Summary
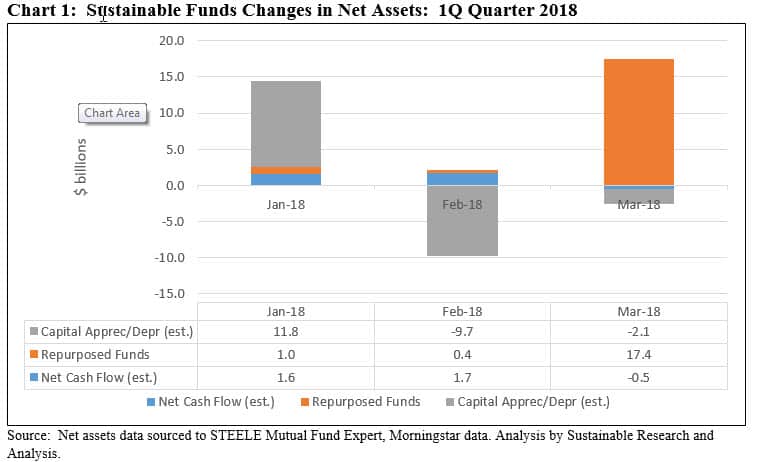
- vAn estimated $2.8 billion, or 1.1%, in net new cash flowed into the sustainable investment funds segment during the three month interval. A much more significant $18.8 billion was added by repurposed funds and funds that were reclassified.
- Sustainable funds ended the first quarter of 2018 with a total of 305 mutual funds and 67 ETFs as well as ETNs, for a total of 909 funds and share classes, with $272 billion in assets under management.
- During the same time interval, traditional asset managers continued to reshape the sustainable investing landscape by adopting environmental, social and governance (ESG)[1] integration strategies into existing funds and, in the process, moving into the ranks of the top 10 sustainable investing firms.
- First quarter performance results posted by sustainable large-cap U.S. equity and investment-grade intermediate-term bond funds that integrate ESG, while negative, exceeded returns produced by their non-ESG counterpart indexes.
- Three material developments that either unfolded or continued to play out in the first quarter, the mass shooting of school kids in Parkland, Florida, Facebook data security and privacy breaches and the rollback of environmental regulations, reflect the challenges on the part of passive investors of trying to avoid investing in certain securities, to the extent they might wish to do so, as well as the relevance of ESG considerations in fundamental investment analysis.
- In a continuing shift, investors, including passive fund investors, are taking a more public position on governance issues while environmental and social issues in proxy voting are expected to reach record numbers during the 2018 proxy season.
Sustainable Funds Post Modest Net Cash Inflows during 1Q 2018, but Segment Expands on the Strength of Repurposed Funds
Sustainable funds ended the first quarter of 2018 with a total of 305 mutual funds and 67 ETFs as well as ETNs, for a total of 909 funds and share classes, with $272 billion in assets under management. That’s up from 750 funds and $250.4 billion in net assets at the end of December 31, 2017, or an increase of 159 funds and $21.6 billion in net assets. Of the increase, $18.4 billion, or 87%, is attributable to repurposed or reclassified funds.
Mutual funds continue to dominate the segment, accounting for $264.3 billion or 97.2% of net assets. Across the entire universe of sustainable funds, only 150 are fixed income oriented with $20.8 billion in net assets, or 7.6%. The other 757 funds with $251.3 billion in assets (92.4%) consist of domestic and foreign equity, balanced and hybrid funds.
Against a backdrop of a stock market turned volatile starting at the end of January, with both U.S. stocks as well as bonds posting negative returns for the quarter, sustainable funds, in the aggregate, expressed on a dollar-value basis, ended the quarter flat, suffering neither capital depreciation or benefiting from capital appreciation. At the same time, it is estimated that sustainable funds added $2.8 billion in net new cash during the same time interval, or a modest increase of 1.1% for the quarter. This limited inflow sourced to net new cash was eclipsed by a total of $18.8 billion added by repurposed funds as well as the reclassification of already existing mutual funds. Refer to Chart 1.
Four fund groups, including Alliance Bernstein, Allianz, Aberdeen and Putnam Investments, repurposed 21 existing funds, a 106 fund share classes in total, and transitioned $18.4 billion in assets under management into the sustainable funds segment. Further, the reclassification of six Knights of Columbus Catholic Investor Funds, consisting of 18 share classes, added $434 million in assets into the sustainable funds segment. Also during the first quarter, seven new funds and share classes were introduced, adding $113.7 million in assets. The largest of these was the DFA Emerging Markets Sustainability Core 1 Portfolio Institutional with $60.7 million in assets. The fund, like other DFA funds in this category, integrates EGS and also excludes certain companies based on their practices.
The Changing Face of the Top Ranked Sustainable Fund Groups
Continuing a trend that was observed in 2017, the adoption of explicit sustainable strategies on the part of traditional investment management firms is transforming the composition of the leading firms within the sustainable funds segment. The market share of the top 10 fund groups has been declining steadily and accounted for 75.7% of total assets in the sustainable investment funds segment at the end of March, down from 79% at year-end 2017 and 84.7% at the end of 2016. Refer to Table 1.
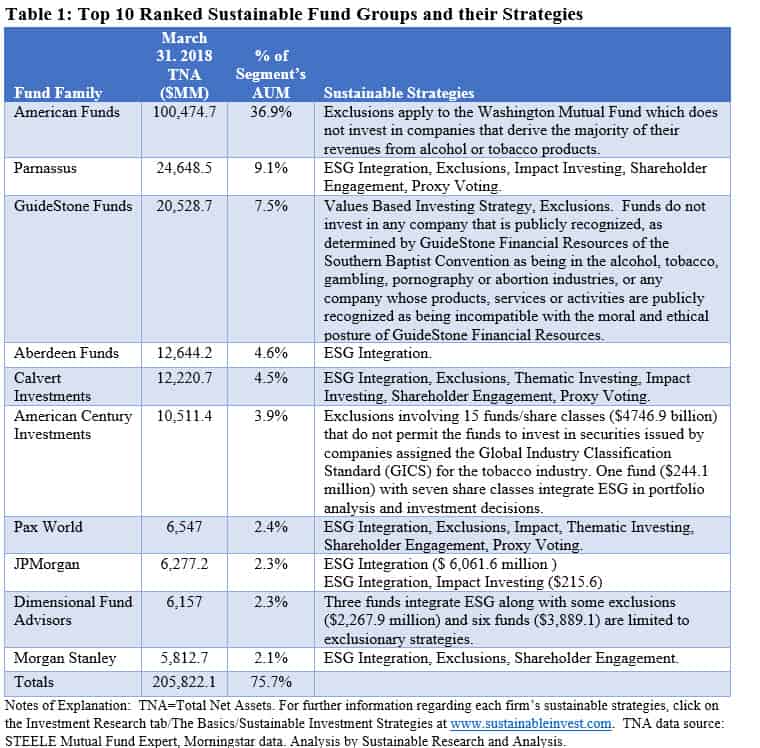
The top 10 firms now include three new entrants in the form of funds managed by Aberdeen Investment Management, J.P. Morgan Investment Management and Morgan Stanley Investment Management. These have displaced Ariel Investments, TIAA-CREF and Neuberger Berman which now rank within a group that make up the next ten sustainable fund firm. Together, these second tier firms capture an additional $35.2 billion in net assets, for a cumulative total of 88.6%. This segment also now includes a new entrant with the addition this year of Putnam Investments.
Exclusionary Strategies Continue to Prevail in Segment while New Entrants Shift to ESG Integration
Based on an analysis of the sustainability strategies employed by the top 10 fund groups, exclusionary strategies, with an emphasis on tobacco and alcohol exclusions, still prevail and account for $114.5 billion in net assets, or 55.7% of the sustainable funds universe. This is followed by funds that pursue multiple strategies by combining ESG integration with exclusions, impact investing, shareholder engagement and active proxy voting (21.2%) and a values-based approach that relies on exclusions (9.2%). It should be noted that regarding ESG integration strategies, a consistent definition or methodology do not apply.
Sustainable U.S. Large Cap Equity and Investment Grade Bond Intermediate-Term Bond Funds Outperform non-ESG Benchmarks for the Quarter
In the aggregate, sustainable funds posted an almost flat -0.26% total return for the quarter, ranging from a high of 7.19% to a low of -6.78%[2]. Within this universe, large segments of similarly managed sustainable funds, in particular, U.S. large-cap equity funds and intermediate-term investment grade bond funds, outperformed non-ESG benchmarks during the first three months of the year.
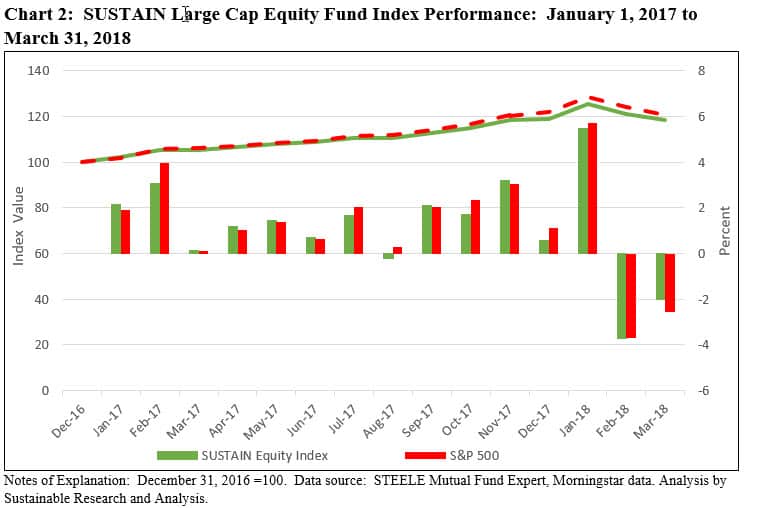
This can be gleaned by reviewing the first quarter’s performance results recorded by the Sustainable (SUSTAIN) Large Cap Equity Fund Index and the Sustainable (SUSTAIN) Bond Fund Indicator. The SUSTAIN Large Cap Equity Fund Index, which tracks the total return performance of the ten largest actively managed large-cap U.S. oriented equity mutual funds that employ a sustainable investing strategy beyond absolute reliance on exclusionary practices, ended the quarter slightly ahead of the S&P 500 Index, posting a total return of -0.48% versus -0.76%, or an advantage of 28 bps. The SUSTAIN Index performance over the quarter was aided, in particular, by the positive results achieved by Calvert Equity Fund A (+2.73%), the Neuberger Berman Socially Responsible Institutional Shares (+0.50%) and Pax Large Cap Fund Institutional Shares (+0.38%). In fact, eight of the ten index constituents outperformed the S&P 500 Index during the three-month interval.
The performance of the SUSTAIN Index for the quarter was bolstered by its excess relative return during the month of March when it gave up -2.00% versus a decline of -2.54% for the S&P 500 Index and an even steeper drop of -3.59% delivered by the Dow Jones Industrial Average (DJIA). Refer to Chart 2.
The stock market posted strong results in January, benefiting from investor expectations for continued economic growth in the U.S. and abroad and higher corporate earnings bolstered by the passage of the Tax Cuts and Jobs Act of 2017 that even a short-lived government shutdown could not derail, investor sentiments began to shift. Cracks began to surface at the end of January due to concerns around trade, inflation, interest rates, and in March fears that social network companies and other internet firms might face revenue constraints if they were to become subject to new regulations designed to protect customer data and user privacy. These worries were likely accentuated by deepening anxiety about the lack of strategic and thoughtful leadership emanating from Washington D.C. and reflected in a dramatic uptick in volatility that began at the very end of the first month. The S&P 500 Index moved up or down by more than 1% during nine trading days in March, 12 trading days in February and in contrast, only two trading days in January, for a total of 23 trading days during the first quarter. This was already triple the number of volatile days in all of 2017.
In general, larger value stocks outperformed growth stocks in March by around 94 basis points, but both market segments sustained declines in excess of 2% while diverging in terms of their performance across the quarter. A slight blend-to-value tilt on the part of the underlying funds may have helped the SUSTAIN Equity Fund Index outperform the S&P 500 Index.
Sustainable Bond Funds Eclipse the Bloomberg Barclays U.S. Aggregate Bond Index by 22 bps but Still Post Negative Results for the Quarter
After posting negative total return results in both January and February, U.S. bonds were a bright spot, in general, for investors in March. A cohort of five sustainable corporate intermediate-term bonds, members of the Sustainable (SUSTAIN) Bond Fund Indicator, recorded a +0.50% gain. Still, the gain in March was not sufficient to offset January through February results and the SUSTAIN Bond Fund Indicator remained in the red for the first quarter. But the recorded loss of -1.24% was 22 basis points lower than the -1.46% posted for the Bloomberg Barclays U.S. Aggregate Bond Index. Four of five funds that make up the indicator outperformed the non-ESG index.
The Sustainable (SUSTAIN) Bond Fund Indicator represents the total return performance of a cohort of five sustainable bond funds consisting of similarly managed funds that, like the SUSTAIN equity index counterpart, employ sustainable investing strategies beyond absolute reliance on exclusionary practices that track the Bloomberg Barclays U.S Aggregate Bond Index.
ESG Related Investment Events Exposed During the First Quarter
Even as the fallout from a number of last year’s relevant ESG linked events, including extreme weather, natural disasters and sexual harassment revelations and reports of assaults against women, spilled over into 2018, three ESG investing issues, in particular, came into clearer focus during the first quarter of 2018: gun violence and the use of semi-automatic style weapons in connection with the Parkland Florida mass shooting, the revelations about Facebook’s data protection and privacy breaches as well as the continuing actions on the part of the Trump Administration’s Environmental Protection Agency (EPA) to roll back environmental regulations.
Parkland, Florida Mass Shooting
Public attention on firearm manufacturers, retailers and even financial institutions has once again been galvanized following the most recent and one of the deadliest mass shooting in the United States when on February 14, 2018 17 people were killed at a high school campus in Parkland, Florida by a former student armed with an AR-15 semi-automatic style weapon. This was the deadliest school shooting since 2012 when 26 people were killed at the Sandy Hook Elementary School in Connecticut, also involving a semi-automatic rifle.
This shooting also renewed calls for institutional investors to sever their ties to the firearms industry and prompted both retail, high net worth and institutional investors to ponder whether they should take action to avoid investing in the stocks and, to a lesser degree, bonds of firearms manufacturers and possibly even firearms retailers as well as financial institutions doing business with firearm manufacturers and retailers. While the effectiveness of divestment, whether focused on genocide, fossil-fuel companies, gender diversity or firearms, and its economic implications for investors continues to be debated, such a path is most challenging in particular for investors and managers of index funds that allocate assets to U.S. and foreign stocks and bonds. This is the case regarding divestment from the firearms industry which largely and directly impacts mid-cap and small-cap indexes and perhaps less so foreign indexes (world ex-US) which have exposure to four arms manufacturers. Also by extension, these holdings spread to indexes that encapsulate mid-cap and small-cap stocks such as total stock market indexes, growth/value configurations and other variations based on the same fundamental indexes. But if divestment is also extended to include firearms retailers, of which there could be at least three, this course of action also impacts large-cap stock and corporate bond indexes.
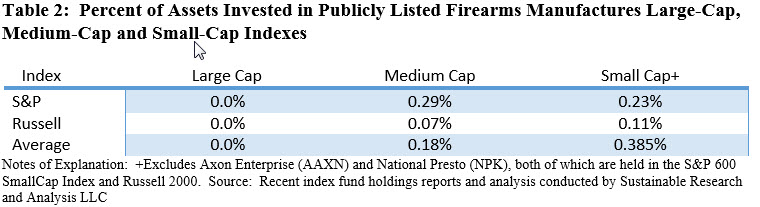
Because of their respective sizes based on market capitalization, four companies in particular, American Outdoor Brands (AOBC), Olin Corporation (OLN), Sturm, Ruger & Co. (RGR) and Vista Outdoor (VSTO) are found in indexes that seek to replicate the performance of mid-cap and small-cap indexes and by extension indexes that encapsulate these segments into boarder parts of the capital markets, growth/value derivations as well as other variations such as equal weighting constructs. The most popular of the mid-cap and small-cap indexes are the S&P SmallCap 600 Index, S&P MidCap Index, Russell 2000 Index and the Russell Midcap Index. The most popular extension indexes would include the Total Market Index, Russell 3000, S&P 1500 Index and the series of corresponding growth and value indexes.
An analysis limited to the stock holdings of the most fundamental mid-cap and small-cap indexes reveals that investors in corresponding index mutual funds and ETFs are exposed to the stocks of the four weapons companies noted above. Exposures range from an average of 0.18% held in mid-cap indexes to 0.385% held in small-cap indexes. This is illustrated in Table 2. To the extent that investors at the same time invest in the popular extension indexes, their aggregate exposures to these firms would expand.
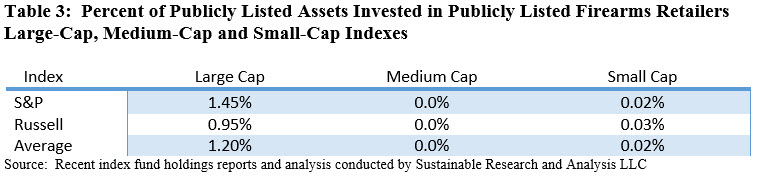
If the universe of excluded investments is expanded beyond firearms manufacturers to include publicly listed U.S. firearms retailers, the largest of which include Wal-Mart Stores, Inc. (WMT), Kroger (selling firearms through its Fred Meyer branded store) (KR), and Dick’s Sporting Goods, Inc. (DKS), the universe of index investors includes large-cap indexes, such as the S&P 500 and Russell 1000, as well as small-cap indexes and here too, by extension, indexes that encapsulate these segments into boarder segments of the capital markets, growth/value configurations and other variations. Moreover, these firms, in particular Wal-Mart Stores and Kroger, are also held as investments in various investment-grade corporate bond indexes, ranging from the broadest Bloomberg Barclays U.S. Aggregate Bond Index to narrower-based indexes qualified as to sector and maturity. That said, an alternative broad bond index that at least excludes Wal-Mart but not Kroger’s is the Bloomberg Barclays MSCI U.S. Aggregate ESG Select Index.
An analysis limited to the stock holdings of the most fundamental large-cap mid-cap and small-cap indexes reveals that investors in corresponding index mutual funds and ETFs are exposed to the stocks of the three retailers above. Exposures range from an average of 0.02% held in small-cap indexes to 1.20% held in large-cap indexes while none are held in mid-cap indexes. This is illustrated in Table 3. To the extent that investors at the same time invest in the popular extension indexes, their aggregate exposures to these firms would expand.
Facebook Data Protection and Privacy Issues Burst into the Open
The revelations in Mid-March that information on as many as 87 million global Facebook account holders, out of 2.13 billion monthly active users, may have been harvested without their consent resurfaced long-standing concerns regarding user data and the firm’s protection and privacy practices. These considerations have been relevant and material fundamental investment risk factors with their possible consequences on the firm’s franchise, including revenues, expenses and profitability, which are also captured as potential social issues within ESG focused on data protection and privacy.
Privacy researchers and developers have been concerned for some years about the enormous amount of information collected by firms like Facebook and making it available to third parties. Facebook has also acknowledged that its advertising revenues could be adversely affected by these and related factors. According to Facebook’s 2017 Annual Report, $40.65 billion in revenues are almost entirely sourced to advertising which would be at some level of risk if marketers, for example, reduced their allocations to Facebook. A reduction in user Facebook engagements, restrictive regulatory or legislative developments that negatively impacts the firm’s ability to access user data, or increased expenses as Facebook intensifies its investments in data security and data vetting, to mention just a few, could also have a material impact on the firm’s financial performance.
While it may be challenging to quantify these financial impacts, Facebook’s Class A share price since these revelations were first made and continuing through the end of March reflected the increased level of concern on the part of shareholders. The stock was down about 8.6% from last month’s high reached on March 9, 2018, reducing Facebook’s market value by about $61.1 billion [Note: the shares have since recovered as of 4/26/2018].
Data protection privacy concerns, other adverse social impacts along with corporate governance issues linked to the lack of board independence, Mark Zuckerberg’s dual role of Chairman and CEO and the multi-class capital structure that allows Mr. Zuckerberg to maintain voting control, have led some but not all sustainable funds to avoid investments in Facebook. This is illustrated through the prism of the ten funds that make up the SUSTAIN Larger Cap Equity Fund Index. Of the ten funds that comprise the index, seven funds don’t have any exposure to Facebook, while three funds invest in Facebook at levels roughly corresponding (within 50 bps) to its exposure in the S&P 500 Index. These include Calvert Equity Fund (2.30%), Domini Impact Equity Fund (2.25%) and VALIC Company II Socially Responsible Fund (1.99%).
U.S. Efforts to Roll Back Environmental Regulations Further Complicate Quantification of Transition and Physical Risks and Opportunities
The Trump administration’s environmental policies, starting with the announced intention last June to withdraw from the Paris Climate Agreement (which under the terms of the agreement can’t happen until November 4, 2019 while the actual withdrawal would then take place one year after or November 4, 2020), have been focused on rolling back many of the gains achieved during President Obama’s term in office. These were aimed to curb climate change and limit environmental pollution, key elements of which included the Clean Power Plan and automobile fuel efficiency standards. As the quarter was nearing an end, reports surfaced that the Environmental Protection Agency (EPA) was planning to announce an initiative to revisit the Obama administration’s fuel efficiency standards for cars and light-duty trucks that would require these vehicles to have average fuel efficiencies equivalent to 54.5 miles per gallon by model year 2025 and reduce vehicle sourced greenhouse gas emissions which in 2016 were responsible for about a sixth of U.S. greenhouse gas emissions. While formally announced on April 2, the implementation of this undertaking is uncertain and is expected to be the subject of significant pushback and litigation. At the same time, these developments introduce hard to quantify financial uncertainties and opportunities due to transition risks for industries and companies exposed to carbon transition risks, ranging from fossil fuel companies, to automobile manufacturers, cement, steel, aviation, shipping and the power sector, to mention a just a few. This is further complicated by a decision announced by the European Commission on February 1, 2018 that the European Union would not sign trade agreements with countries that did not ratify the Paris Climate Agreement.
To the extent that CO2 emissions and other pollutants are not arrested, broader implications can extend to entities exposed to the physical risks linked to climate change, such as cities, health care and agricultural sectors.
Shareholder Proposals in 2018 Proxy Season Shifting to Environmental and Social Issues
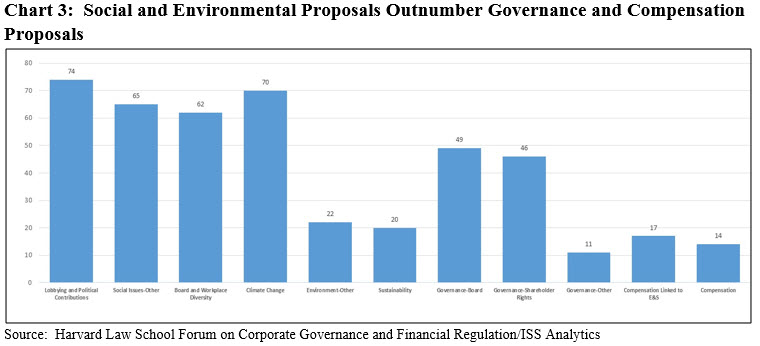
A forward view about what is on the mind of investors regarding the environmental, social and governance agenda may be gleamed from a review of shareholder proposal filings that have been made available to-date as the 2018 proxy season moves into high gear during the second quarter. According to the Harvard Law School Forum on Corporate Governance and Financial Regulation, as of the end of February 2018, 450 proposals were filed with Russell 3000 companies. Of these, 334 were still pending while the rest have already been added to ballots or were omitted or withdrawn.
The trend this year seems to continue on a path wherein social and environmental issues are eclipsing governance and compensation related developments. This can be observed in the data presented in Chart 3 that shows the number of proposals linked to environmental, social and governance issues. Of the 450 proposals that were filed, 201 proposals involve social issues while 112 are associated with environmental concerns and only 106 proposals are associated with governance considerations. Refer to Chart 3.
A decline in traditional governance proposals may be linked to the fact that governance best practices have been more widely adopted on the part of large companies in recent years. At the same time, environmental risks and gender diversity considerations have become widely debated and hot-button issues in the U.S. and elsewhere. While it didn’t begin last year, concerns about environmental risks were further elevated on the heels of extreme storms in 2017, including violent hurricanes Harvey and Irma that ravaged Houston and Puerto Rico as well as raging wild fires that were again punishing vast areas of the American West and, in particular, California. Adding to these concerns are water shortages and the historically warm atmospheric temperatures globally, based on data collected since 1880. Also, the current U.S. administration’s stance on the Paris Climate Agreement and efforts to roll back environmental regulations are pushing various investors in the public and private sector, environmental groups, state and local governments and other public entities to step up their pressure. These entities are seeking corporate commitments to reduce greenhouse gas emissions in line with the aim of the Paris Climate Agreement to limit global temperature increases to 2° Celsius above pre-industrial levels and to secure commitments to improve reporting and disclosure focused on how corporations will meet their targeted reductions.
Such proposals have been receiving increasing levels of support, as illustrated last year when 62.3% of investors voted in favor of a resolution calling for ExxonMobil to publish an annual assessment, starting in 2018, on the company’s oil and gas reserves and resources under a scenario in which reduction in demand results from carbon restrictions and related rules or commitments adopted by governments consistent with the globally agreed upon 2° Celsius target.
[1] ESG integration refers to the systematic and explicit inclusion of ESG risks and opportunities in investment analysis.
[2] Excluding the return of 69.71% posted by the iPath Global Carbon ETN.