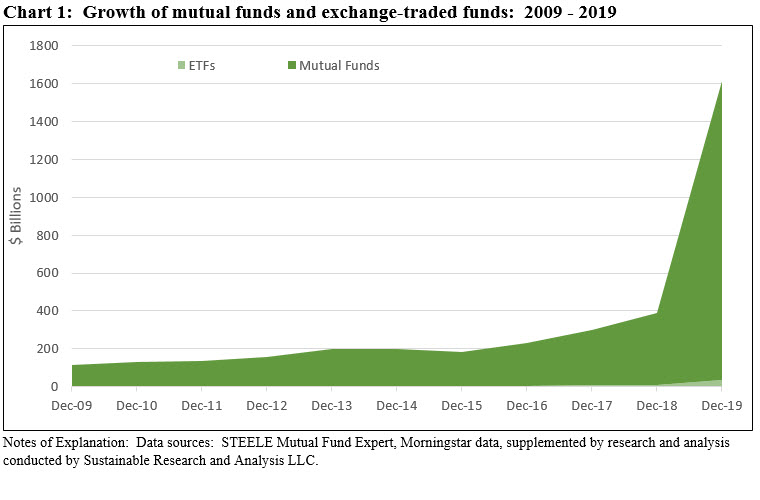
The total net assets of mutual funds and exchange traded funds (ETF)(1) sourced to sustainable investing approaches expanded dramatically in the last decade, adding almost $1.5 trillion in the last ten years. Assets increased from $113.5 billion at the start of the decade to reach $1.6 trillion at the end of 2019, fueled largely by fund re-brandings, followed, but to a much less significant extent, market movement and net new money. Refer to Chart 1.
The number of firms offering sustainable fund products, fund offerings and types as well as investors also increased significantly. In the process, investors and the allocation of sustainable assets across fund types and sectors shifted markedly as did the dominant form of strategies pursued by leading sustainable investment companies and their fund offerings. While the definition of sustainable investing continues to evolve, this refers to a range of overarching investing approaches or strategies that encompass values-based investing, negative screening (exclusions), thematic and impact investing, ESG integration, company engagement and proxy voting. These are not mutually exclusive.
Assets expanded modestly during the first half of the decade, but gained considerable traction starting in 2016. In the last five years, assets added $1.4 trillion or 95% of the decade’s total. It’s not coincidental that this interval followed the signing of the Paris Climate Agreement of 2015 (COP 21). But in addition to heightened sensitivity to climate change and the risks and opportunities associated with this universal threat and all its implications, other factors also influenced the growth. Not in any particular order, other contributing factors include worrisome societal trends such as gender and income inequality, gun violence, water scarcity, poverty, migration, education and a perceived deterioration in corporate governance standards that many believe contributed to the financial crisis beginning in 2008. Prompted by governments, regulators, businesses, investors and customers, the recent evolution in sustainable investing is informed by the view that the achievement of positive societal outcomes via sustainable finance is consistent with long-term value creation. Viewed another way, investors can achieve, at minimum, market-based financial results while also having a positive impact on society.
Mutual funds and ETFs: Mutual funds continue to dominate and account for 98% of segment’s assets
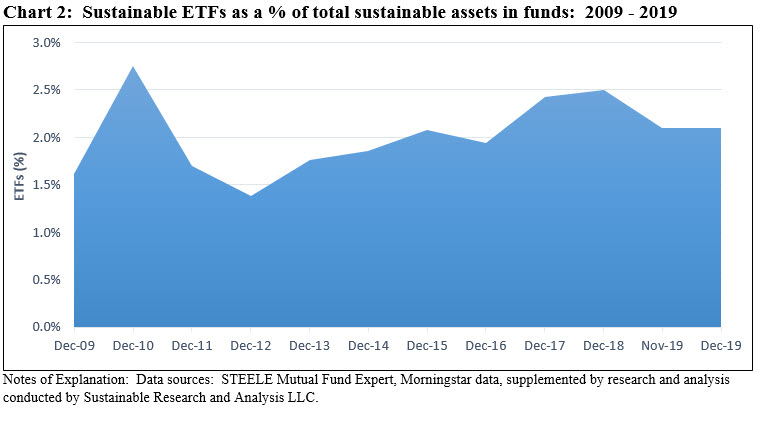
At the start of 2010, a combined total of 165 mutual funds and ETFs were offered by 59 separate firms with $113.5 billion in assets under management. To put this into context, this segment made up only a small 1% fraction of all mutual funds and ETFs(2) at the end of 2009. Mutual funds dominated the segment with 149 funds on offer, consisting of 341 funds/share classes and $111.6 billion in net assets. In addition to mutual funds, the sustainable funds segment included 16 ETFs with $1.8 billion in assets. Mutual funds accounted for 98.4% of sustainable fund assets under management and this relationship has not changed materially in the ten year interval to 2019. In fact, today mutual funds account for 97.9% of sustainable fund net assets while ETFs, currently at 2.1%, never exceeded 2.75% between 2010 and 2019. This level compares to 16.9% for conventional fund and ETF assets.
From 149 mutual funds available to retail and institutional investors via 341 funds/share classes offered by 59 separate firms, mutual fund offerings jumped to 977 funds and 3,460 funds/share classes covering $1,577 billion in assets under management at the end of 2019. At the same time, ETFs added a net number of 100 investment vehicles to end 2019 with 116 ETFs and $33.7 billion in net assets. Together, these two investment vehicles now account for about 6% of the mutual fund and ETF industry’s assets under management(3). Refer to Chart 2.
Growth in sustainable assets under management almost entirely attributable to re-brandings of existing funds over the last two years
Over the last two years but, in particular, over the course of the last thirteen months of the decade, fund re-brandings ramped up and contributed materially to the growth of sustainable funds and assets under management. In this context, fund re-brandings refers to the formal adoption of a sustainable investing strategy or approach by an existing mutual fund or exchange traded fund in the form of an amendment to the fund’s offering document (i.e. prospectus).
Starting in January 2018 and continuing through year-end 2019, 47 separate fund firms re-branded a total of 460 funds comprised of 2,083 funds/share classes, including ETFs, with total net assets of $1.2 trillion. This activity accounts for 92.3% of the growth in sustainable fund assets during the two-year interval that also benefited, in order of importance, from market appreciation and net positive cash flows. Refer to Chart 3.
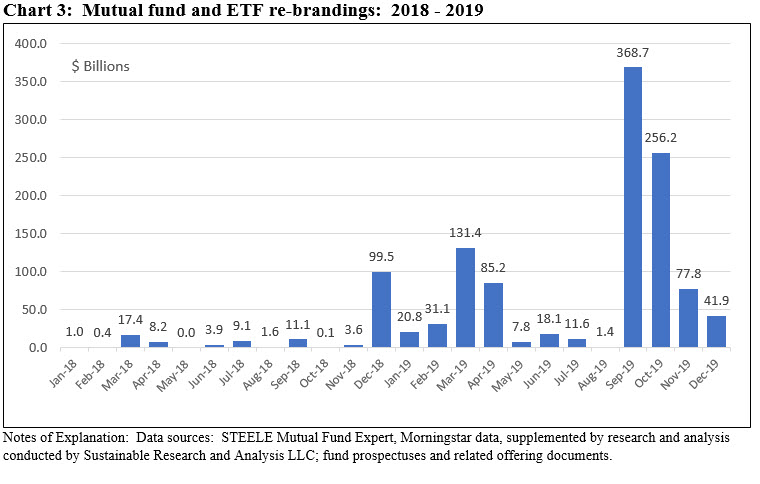
Fund re-brandings allows management firms to scale up and offer sustainable fund products quickly and without incurring incremental costs while at the same time avoiding the incidence of capital gains/losses that would be incurred if investors were required or had a desire to shift their investments from conventional funds to sustainable funds. In the process, the sustainable investing segment has been transformed but this has also contributed to misunderstanding and confusion about the meaning of sustainable investing, strategies and outcomes that can best be ameliorated with greater transparency and disclosures.
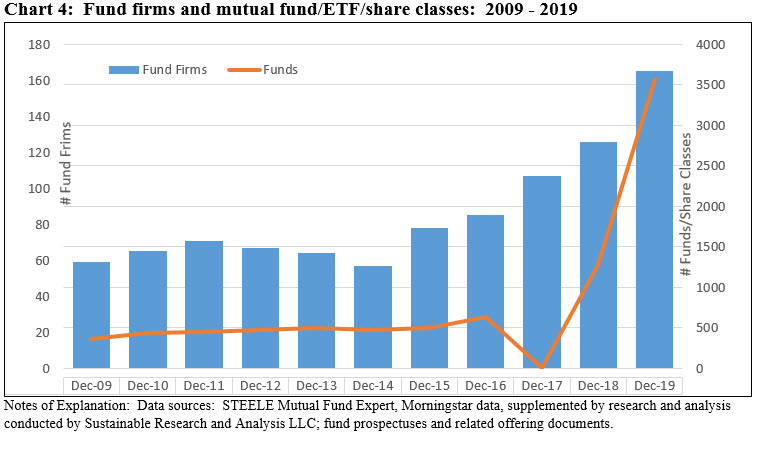
Fund groups offering sustainable fund products increase from 59 to 165 separate firms
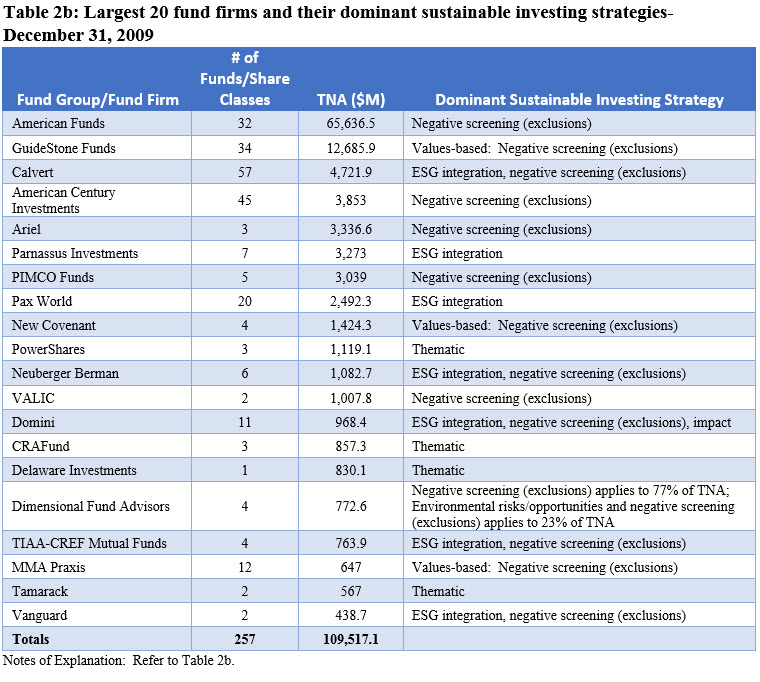
At the start of the decade, a total of 59 firms offered sustainable investment funds and ETFs. These ranged from firms offering as few as a single fund to as many as 45 fund offerings with combined assets ranging from a low of $3.6 million to $65.6 billion. As is the case at the end of 2019, the sustainable funds segment was highly concentrated at the start of 2010 with the top 20 fund groups accounting for $109.5 billion in assets under management or 97% of the segment’s assets.
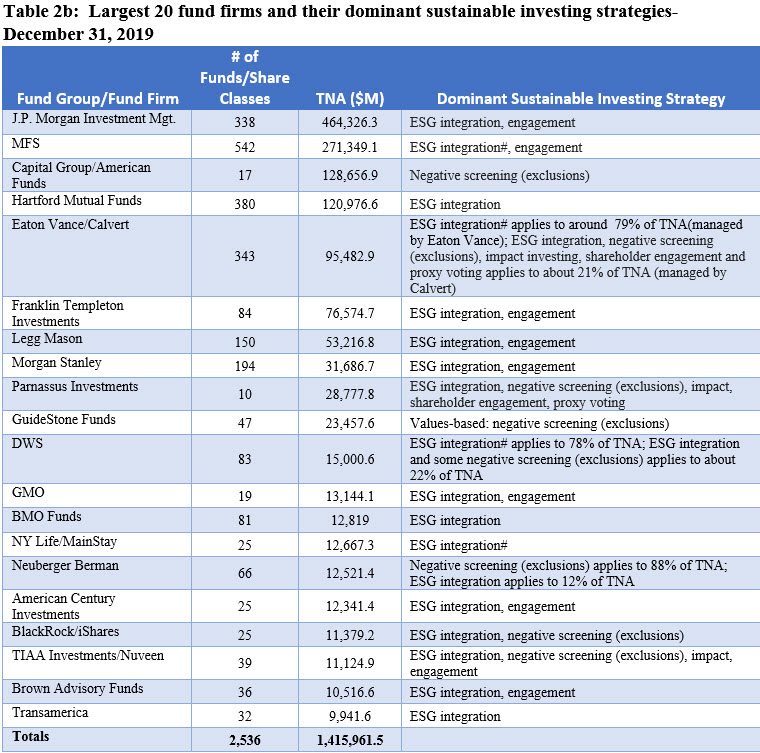
The number of firms offering sustainable funds and ETFs stood at 165 firms at the end of the decade, or almost a three-fold increase. Firms offer as few as one fund to as many as 542 funds/share classes in the case of MFS (Massachusetts Financial Service Company). Assets range from $0.2 million to a high of $464.3 billion currently managed by J.P. Morgan Investment Management. While the level has declined a bit, the segment remains highly concentrated, with the top 20 firms controlling $1.4 trillion in net assets. This represents 88% of the segment’s total net assets at the end of 2019.
Only five of the original top twenty firms at the start of 2010 retained their position 10 years later. These include Capital Group’s American Funds, Eaton Vance/Calvert, Parnassus, GuideStone Funds, Neuberger Berman and TIAA Investments. Refer to Chart 4.
Fund types/sector allocation of sustainable funds in 2009 versus 2019: Composition more closely in alignment now with conventional funds and ETFs
Sustainable fund assets at the end of 2009 were dominated by equity funds, both in the number of funds and assets under management. Equity funds accounted for $88.4 billion, or 77.9% of net assets. Taxable bond funds and balanced funds sourced a combined total of $18.2 billion or 16.1% of net assets while money market funds accounted for just 1.2% of assets.
At the end of 2019, US equity and sector equity funds represent 43.5% of assets while bonds funds, both taxable and municipal bond funds, make up $339.3 billion or 21.1% of assets. Another dramatic shift occurred due to the rebranding of existing money market funds that, as a result, now account for $299.0 billion in net assets or 18.6% versus just 1% at the end of 2009. Refer to Chart 5.
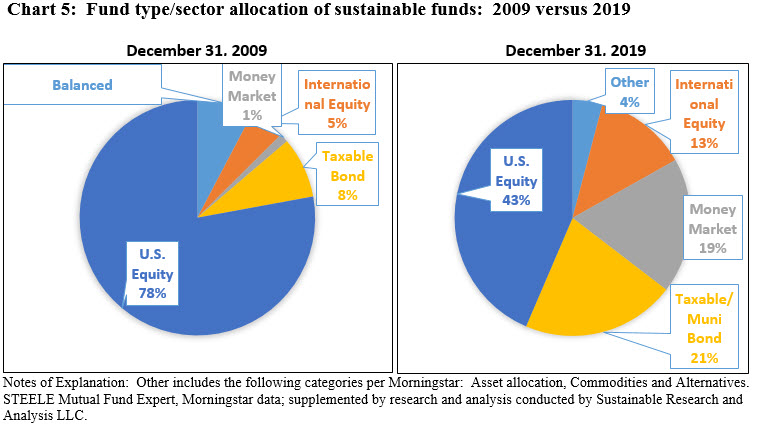
Unlike their allocation profile by fund type/sector at the start of the decade, the composition of sustainable funds at the end of 2019, not unexpectedly as the universe expanded, more closely resembles the combined profile of conventional mutual funds and ETFs.
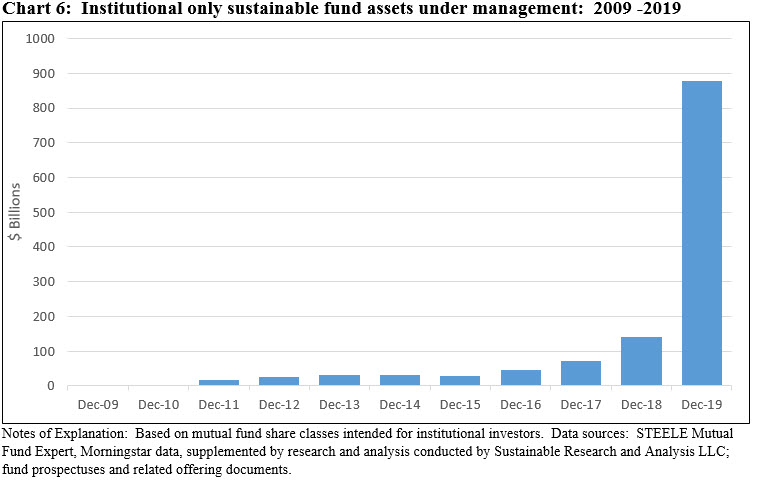
Institutional investors: Now accounting for at least 56% of sustainable fund assets versus 8% a decade ago
At the start of the decade, 78 funds/share classes with $8.9 billion in net assets were intended for investment by institutional investors. This segment, viewed through the prism of mutual funds only, accounted for 8% of assets as of December 31, 2009. In contrast, at the end of 2019, institutional only funds and their assets expanded to 1,162 funds/share classes and $878.7 billion, or 55.7% of the mutual fund segment’s net assets. To be sure, institutional investors, in addition to investments in ETFs, likely have an event greater footprint within the sustainable mutual funds segment due to the fact that this class of investors is also likely to be directing funds through other available share classes that are not otherwise restricted to institutional investors. Refer to Chart 6.
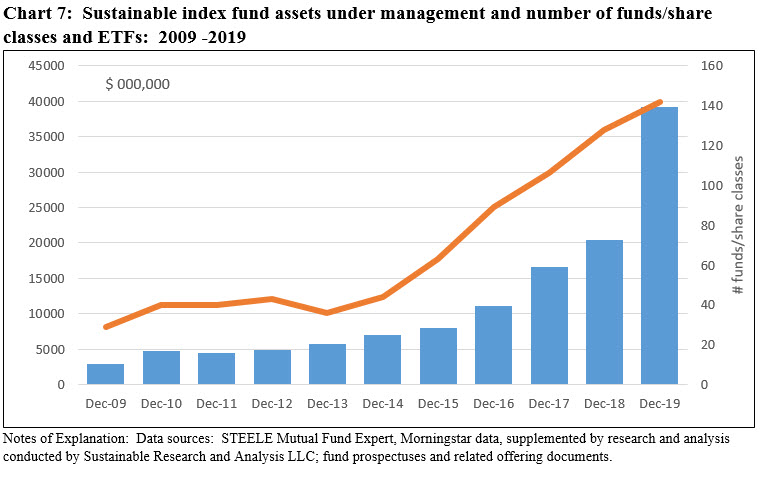
Sustainable index funds which make up 2.6% of assets trail counterparts in the conventional funds industry
Sustainable index funds experienced an increase over the decade, but the increase has not been commensurate with the growth of index funds across the mutual fund industry. At the start of 2010 there were 29 sustainable index funds/share classes with total net assets of $2.9 billion, or 2.6% of sustainable fund assets. As a proportion of mutual funds and ETFs, index funds accounted for 17.9% of net assets at the start of 2010, or almost 7X times greater. Passively managed mutual funds and ETFs expanded to $6.6 trillion or 36.4% of conventional funds under management(4). During the same interval, sustainable index fund assets increased to $39.2 billion but remained at just 2.4% of net assets. Refer to Chart 7. The comparative position of sustainable index funds may be attributable to several factors but, in the end, this may just be a function of timing and the near-term skewing of assets due to fund re-brandings that could normalize over time.
Eight green bond funds end 2019 with record $590.6 million in assets
Green bond funds did not exist at the start of the decade. The first green bonds were issued in 2007, but the earliest green bond fund was launched by Calvert Research and Management (now a subsidiary of publicly traded Eaton Vance) in October 2013. Calvert’s $418.4 million green bond fund is not only the oldest offering but it also remains the largest, accounting for 71% of fund assets dedicated to green bonds.
Since its launch in 2013, Calvert has been joined by seven other firms that, at the end of 2019, managed a total of $590.6 million in green bond assets offered in the form of five mutual funds and two ETFs. The latest entrants include Franklin Templeton that introduced a municipal green bond fund in November 2019 and PIMCO that announced the formation of a fund that invests opportunistically in a broad spectrum of climate focused instruments and debt from issuers demonstrating climate leadership. Refer to Chart 8.
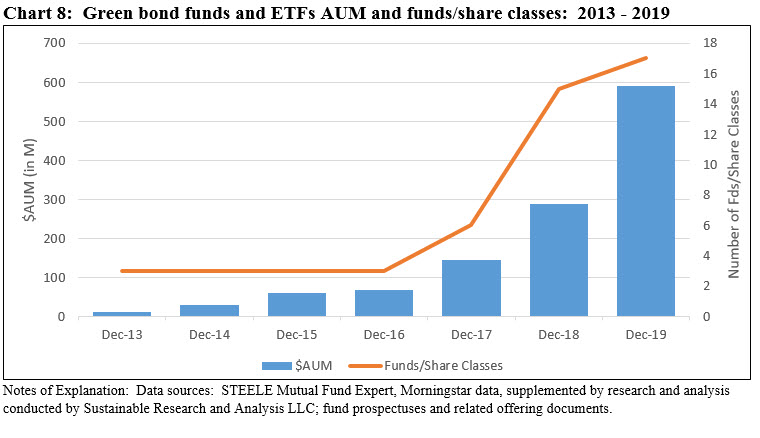
This year, an estimated $286 billion in green bonds were issued, and a cumulative total of about $813 billion since 2007.
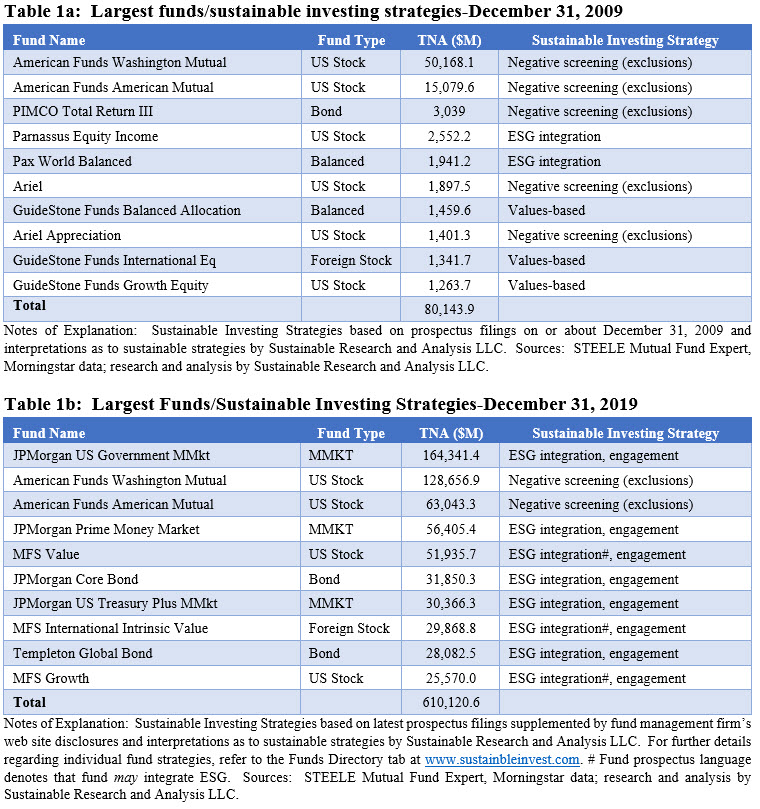
Largest 10 funds(5) shift from negative screening to ESG integration
At the beginning of the decade, the ten largest funds consisted of US stock, bond, balanced and foreign funds with $80.1 billion in net assets or 70.6% of the entire segment’s assets under management. In contrast, the assets of the top ten funds at the end of 2019 stood at $610.1 billion but only accounted for 38% of the entire segment’s assets. Moreover, three of the top 10 funds are money market funds, none of which rose to this level at the start of the decade.
Negative screening or exclusions for alcohol and tobacco was the principal strategy employed by five funds that represent 89.3% of assets at the start of 2010. When values-based investing is added, the total reaches 94.4%. Two funds, with a combined total of $4.5 billion in net assets, or 4%, employed an ESG integration approach. Further, this segment was dominated by US equity mutual funds, the largest of which included Washington Mutual and American Mutual, both part of the Capital Group’s American Funds group. Both investment companies, which exclude firms involved with alcohol and tobacco, have remained a prominent fixture in the sustainable investment category through the end of the decade. At the start of the decade, the two funds managed a combined total of $65.2 billion and accounted for 57.5% of the segment’s net assets. Assets under management increased to $293 billion at December 31, 2019 while the funds’ market share declined to 18.2%. The rest of the top 10 segment at the end of 2019 is comprised of funds that have adopted ESG integration approaches to investment decision making along with investee engagement. As used today, ESG integration refers to the systematic and consistent accounting of ESG risks and opportunities in investment decision making when these are considered to be relevant and material. That said, ESG integration commitments and approaches can and do vary.
Excepting for one re-branding and one name change, the top ten funds at the end of 2009 continue in operation to-date although just the two American Funds referenced above have retained their position within the top 10 ranked funds at the end of the decade. Refer to Table 1a and Table 1b.
Dominant sustainable investing strategies across largest 20 firms at YE 2019: ESG integration
An examination via the prism of the largest 20 sustainable fund firms to determine the dominant sustainable investing approach employed by mutual funds and ETFs, both at the start of the decade and the end of the decade, further illustrates the extent to which the sustainable investing landscape has shifted in ten years.
At the start of the decade, negative screening, largely focused on excluding alcohol and tobacco companies, was the source for about $77.5 billion or 71% of the assets managed by the top 20 firms. Another $14.8 billion in assets, or 13.5%, were managed pursuant to values-based strategies, including faith-based practices focused on Christian, Baptist, Lutheran and Methodist religious principles or ethical values. These two approaches combined made up 84.5% of net assets. The remainder was allocated across firm assets that employed ESG integration strategies, either exclusively or in combination with negative screening (exclusions) and, in some cases, also impact investing strategies.
While a shift began to unfold before year-end 2019, at the end of the decade, the sustainable funds sphere is dominated by funds employing ESG integration strategies either exclusively or in combination with one or more companion approaches, such as negative screening (exclusions), impact, or engagement. Across the top 20 fund firms, assets sourced to ESG integration stood at almost $1.3 trillion, accounting for 88% of assets. ESG integration is an approach that was largely favored by firms that re-branded their funds over the previous two-years in particular, including four firms in the top 20 that adopted less explicit prospectus language by disclosing that ESG may be factored into investment decision making. These firms source $368.3 billion in net assets, or 26%. Three firms within the top 20, with $163.1 billion or 12% of assets, offer funds that exclusively employ a negative screening (exclusionary) approach. Refer to Table 2a and Table 2b.
Footnotes:
(1) Also includes a small number of exchange traded notes (ETNs).
(2) Source for mutual fund and ETF net assets as of 12/31/2009, ICI Hanbook.
(3) Based on mutual fund and ETF net assets as of November 2019, per ICI.
(4) Based on data as of December 31, 2018.
(5) Sustainable fund strategies as of 12/31/2009 based on sustainable investing approaches applicable at the time.
A word about the data: The universe of sustainable funds, both mutual funds and ETFs/ETNs covered in this analysis are all tagged as Socially Responsible by Morningstar. This was the starting point for further independent research and analysis conducted by Sustainable Research and Analysis LLC to both identify and classify funds into more granular sustainable investing strategies, using fund offering documents and at time firm web site disclosures. To this end, funds have been classified into one or more of the following sustainable overarching investing approaches or strategies: values-based investing, negative screening (exclusions), thematic and impact investing, environmental, social and governance (ESG) integration, company engagement and proxy voting. Some funds were excluded from the analysis when it wasn’t possible to validate a sustainable investing strategy of any type.