The Bottom Line: Actively managed US funds posted excellent absolute returns in 2019 but lagged behind indices again while sustainable funds delivered somewhat better results.
Actively managed US Equity and bond funds post excellent absolute returns in 2019 but continue to lag behind indices while sustainable funds delivered better results
On April 3, S&P Dow Jones Indices released its latest S&P Indices Versus Active (SPIVA) U.S. Scorecard, a compilation published by the firm since 2002 that quantifies the performance of active managers versus comparable securities market indices. The just published results covering the period through the end of 2019 reaffirmed that US equity and fixed income managers posted excellent absolute results. The S&P 500 gained 31.5% and the Bloomberg Barclays US Aggregate Index posted an increase of 8.7%. According to the SPIVA Scorecard, however, 71% of actively managed US equity large-cap funds underperformed the S&P 500 in 2019 versus 64.5% that did so in 2018. Actively managed investment grade intermediate fixed income funds achieved much better results as a much smaller segment, 32.2%, underperformed. This represents a significant turnaround from the prior year when 90.8% of managers underperformed the conventional benchmark. Overall, active managers continue to underperform against their securities market benchmarks. Against this background, Sustainable Research and Analysis juxtaposed the results achieved last year by sustainable investment funds tracked by two sustainable fund indices, the Sustainable (SUSTAIN) Large Cap Fund Index and the Sustainable (SUSTAIN) Bond Fund Index. Both SUSTAIN indices outperformed their corresponding conventional indices in 2009 and what’s more, 70% of the equity fund and 60% of the bond fund constituents achieved results equal to or greater than their corresponding benchmarks with lower levels of volatility on average. At the same time, the cumulative two and three-year outcomes posted by the two SUSTAIN indices are less inspiring.
The SPIVA Scorecard funds data base
The SPIVA Scorecard data base consists of actively managed mutual funds and avoids double counting multiple classes of funds in the calculations by relying only on one share class per fund with the greatest assets. Index funds, leveraged funds and inverse funds are excluded from consideration. The data base also corrects for survivorship bias, a situation that arises due to fund mergers and liquidations. The performance of funds is evaluated on an apples-to-apples basis by measuring returns against a benchmark appropriate for the particular investment category. Funds are also controlled for style drift. The number of funds evaluated varies by the time horizon under consideration. For the 1-year period ended in 2019, 2,141 equity funds were analyzed and a sub-set of 789 funds were classified as US equity large cap funds. As for bonds, 962 funds were analyzed over the same time period, including 199 investment-grade intermediate funds.
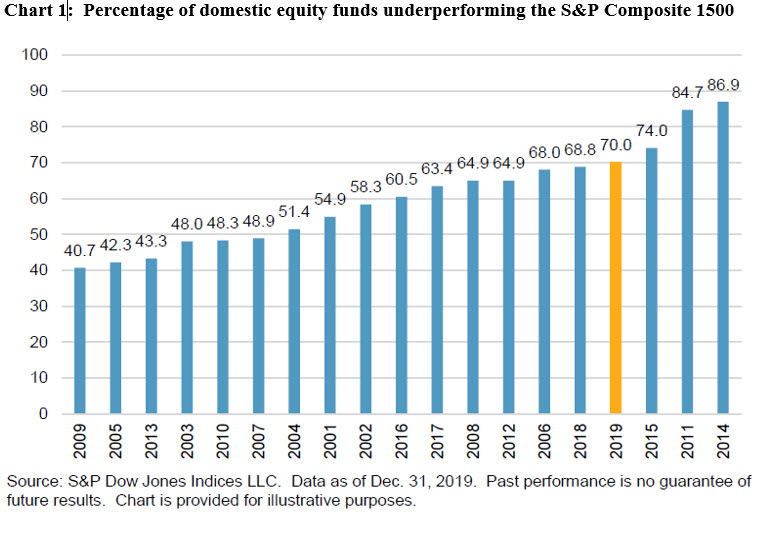
According to the latest SPIVA Scorecard, active managers continue to underperform against their securities market benchmarks. For example, 70% of domestic equity funds lagged the S&P Composite 1500 over the 1-year period ended December 31, 2019. This compares to 68.8% the previous year and 86.9% of funds that underperformed in 2014—the worst year since the Scorecard was launched. Refer to Chart 1. That said, levels of relative outperformance or underperformance vary by asset class and investment category or style. For example, investment grade intermediate term funds generated excellent absolute returns while also achieving a 67.8% level of outperformance relative to benchmark.
SUSTAIN benchmarks: SUSTAIN Large Cap Equity Fund Index and SUSTAIN Bond Fund Index
The Sustainable (SUSTAIN) funds indices, including the Sustainable (SUSTAIN) Large Cap Equity Fund Index, Sustainable (SUSTAIN) Bond Fund Index and the Sustainable (SUSTAIN) Foreign Equity Fund Index, are designed to track the total return performance of three sectors of the actively managed sustainable mutual funds and exchange-traded funds (ETFs) market segment. These indices track the performance of like funds based on their investment and sustainable strategy[1] approaches. In each instance, the indices track the performance of the largest share class of the ten largest actively managed qualifying mutual funds and ETFs. At this juncture, the track records accumulated for these indices is still limited. The SUSTAIN Large Cap Equity Fund Index, which was initiated as of June 30, 2017 with data back to December 31, 2016, tracks the total return performance of the ten largest actively managed large cap blend domestic equity mutual funds that employ a sustainable investing strategy beyond absolute reliance on exclusionary practices for religious, ethical or social reasons. Using a similar construction approach, the SUSTAIN Bond Fund Index was initiated as of December 31, 2017 while the SUSTAIN index tracking foreign funds has only been calculated since mid-2019 due to the limited availability of like funds prior to that date. As such, this index is excluded from the analysis. For further details regarding construction methodology and current constituents, refer to Sustainable (SUSTAIN) Indices Construction Methodology article.
SUSTAIN Large Cap Equity Fund Index: Beat S&P 500 in 2019 with seven of ten funds outperforming—only 30% underperforming
The SUSTAIN Large Cap Equity Fund Index beat the S&P 500 Index in 2019 by 78 basis points (bps), recording a gain of 32.27% versus an increase of 31.49% produced by the S&P 500. Seven of the ten funds that comprise the SUSTAIN Index generated results that were equal to or greater than the conventional benchmark. These ranged from 31.49% recorded by TIAA-CREF Social Choice Equity Fund Institutional Class to a high of 35.84% achieved by Putnam Sustainable Leaders Fund A. Put another way, only 30% of the funds that comprise the index underperformed the S&P 500 versus 71% on the part of conventional funds, according to SPIVA. Refer to Chart 2.
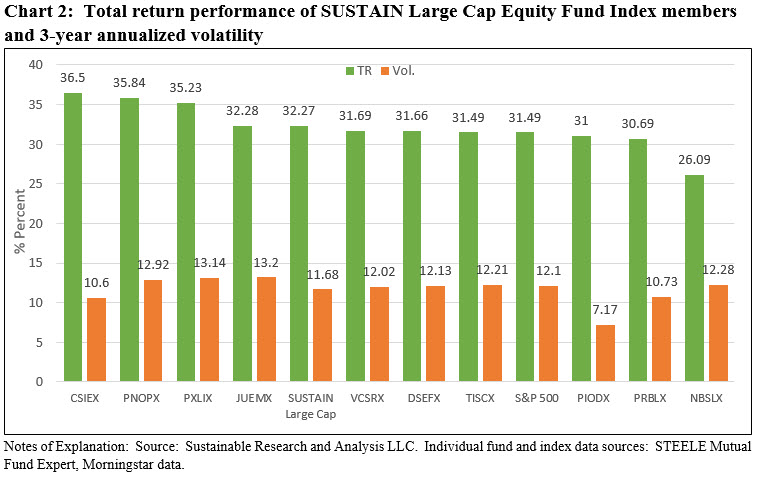
The average volatility of the ten funds that make up the index, measured as the annualized 3-year standard deviation of returns, is 11.7% versus 12.1% for the S&P 500. Three funds recorded lower than benchmark volatilities and one fund in particular, Pioneer A, posted a 3-year volatility of 7.17% that contributed to the lower average volatility for the 10 fund index.
The results recorded by sustainable funds in 2019 contrast with outcomes registered in both 2017 and 2018 when the SUSTAIN Large Cap Equity Fund Index lagged behind the S&P 500 by 54 bps and 97 bps, respectively. Over the cumulative 3-year period through December 31, 2019, the S&P 500 posted an increase of 53.2% versus an equivalent 49.2% achieved by the SUSTAIN Large Cap Equity Fund Index, or a differential of 3.97%.
SUSTAIN Bond Fund Index: Beat the Bloomberg Barclays US Aggregate Index by 18 bps in 2019 with six of ten funds outperforming-40% underperforming
Like its US equity fund counterpart, the SUSTAIN Bond Fun Index outperformed the Bloomberg Barclays US Aggregate Index by 18 bps, posting an increase of 8.90% versus 8.72%. In this instance, six of the ten funds that comprise the SUSTAIN index generated results that were equal to or greater than the conventional benchmark. These ranged from a low of 8.73% registered by the TIAA-CREF Social Choice Bond Institutional Fund to a high of 10.71% delivered by the Morgan Stanley Institutional Core Plus Fixed Income Institutional Fund. Stated another way, 40% of the funds that comprise the index underperformed the conventional fixed income benchmark. This was actually almost 8% higher when compared to conventional fixed income funds[2]. Refer to Chart 3.
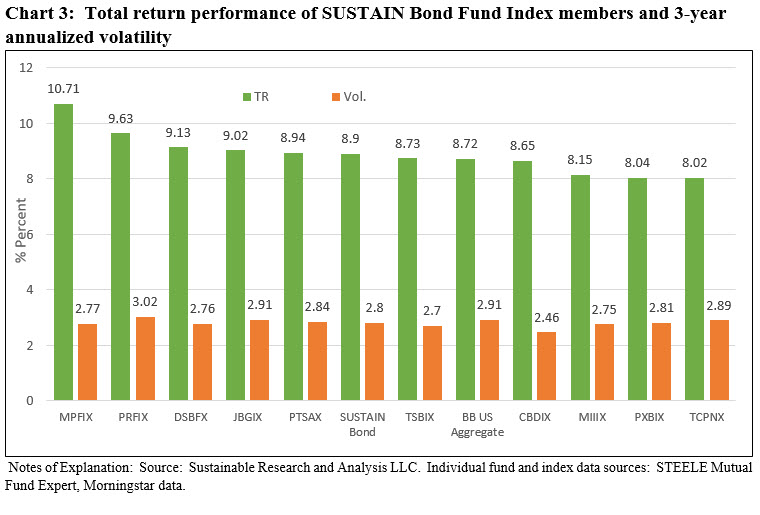
The average volatility of the ten funds that form the index, measured as the annualized 3-year standard deviation of returns, is 2.8% versus 2.9% for the Bloomberg Barclays US Aggregate Index. Nine funds recorded lower or equal to benchmark volatilities, ranging from 2.46% to 2.99%.
The SUSTAIN Fixed Income Fund Index, which was bootstrapped in 2018, lagged that year. Its cumulative 2-year performance, however, puts it ahead of the Bloomberg Barclays US Aggregate Funds Index by 2 bps, having added 11% versus 10.8%.
[1] While the definition of sustainable investing continues to evolve, this refers to a range of overarching investing approaches or strategies that encompass values-based investing, negative screening (exclusions), thematic and impact investing, environmental, social and governance (ESG) integration, company engagement and proxy voting. These are not mutually exclusive.
[2] Bloomberg Barclays US government/Credit Intermediate Index
Active Management of Sustainable Funds vs. 2019 SPIVA Scorecard
The Bottom Line: Actively managed US funds posted excellent absolute returns in 2019 but lagged behind indices again while sustainable funds delivered somewhat better results.
Share This Article:
The Bottom Line: Actively managed US funds posted excellent absolute returns in 2019 but lagged behind indices again while sustainable funds delivered somewhat better results.
Actively managed US Equity and bond funds post excellent absolute returns in 2019 but continue to lag behind indices while sustainable funds delivered better results
On April 3, S&P Dow Jones Indices released its latest S&P Indices Versus Active (SPIVA) U.S. Scorecard, a compilation published by the firm since 2002 that quantifies the performance of active managers versus comparable securities market indices. The just published results covering the period through the end of 2019 reaffirmed that US equity and fixed income managers posted excellent absolute results. The S&P 500 gained 31.5% and the Bloomberg Barclays US Aggregate Index posted an increase of 8.7%. According to the SPIVA Scorecard, however, 71% of actively managed US equity large-cap funds underperformed the S&P 500 in 2019 versus 64.5% that did so in 2018. Actively managed investment grade intermediate fixed income funds achieved much better results as a much smaller segment, 32.2%, underperformed. This represents a significant turnaround from the prior year when 90.8% of managers underperformed the conventional benchmark. Overall, active managers continue to underperform against their securities market benchmarks. Against this background, Sustainable Research and Analysis juxtaposed the results achieved last year by sustainable investment funds tracked by two sustainable fund indices, the Sustainable (SUSTAIN) Large Cap Fund Index and the Sustainable (SUSTAIN) Bond Fund Index. Both SUSTAIN indices outperformed their corresponding conventional indices in 2009 and what’s more, 70% of the equity fund and 60% of the bond fund constituents achieved results equal to or greater than their corresponding benchmarks with lower levels of volatility on average. At the same time, the cumulative two and three-year outcomes posted by the two SUSTAIN indices are less inspiring.
The SPIVA Scorecard funds data base
The SPIVA Scorecard data base consists of actively managed mutual funds and avoids double counting multiple classes of funds in the calculations by relying only on one share class per fund with the greatest assets. Index funds, leveraged funds and inverse funds are excluded from consideration. The data base also corrects for survivorship bias, a situation that arises due to fund mergers and liquidations. The performance of funds is evaluated on an apples-to-apples basis by measuring returns against a benchmark appropriate for the particular investment category. Funds are also controlled for style drift. The number of funds evaluated varies by the time horizon under consideration. For the 1-year period ended in 2019, 2,141 equity funds were analyzed and a sub-set of 789 funds were classified as US equity large cap funds. As for bonds, 962 funds were analyzed over the same time period, including 199 investment-grade intermediate funds.
According to the latest SPIVA Scorecard, active managers continue to underperform against their securities market benchmarks. For example, 70% of domestic equity funds lagged the S&P Composite 1500 over the 1-year period ended December 31, 2019. This compares to 68.8% the previous year and 86.9% of funds that underperformed in 2014—the worst year since the Scorecard was launched. Refer to Chart 1. That said, levels of relative outperformance or underperformance vary by asset class and investment category or style. For example, investment grade intermediate term funds generated excellent absolute returns while also achieving a 67.8% level of outperformance relative to benchmark.
SUSTAIN benchmarks: SUSTAIN Large Cap Equity Fund Index and SUSTAIN Bond Fund Index
The Sustainable (SUSTAIN) funds indices, including the Sustainable (SUSTAIN) Large Cap Equity Fund Index, Sustainable (SUSTAIN) Bond Fund Index and the Sustainable (SUSTAIN) Foreign Equity Fund Index, are designed to track the total return performance of three sectors of the actively managed sustainable mutual funds and exchange-traded funds (ETFs) market segment. These indices track the performance of like funds based on their investment and sustainable strategy[1] approaches. In each instance, the indices track the performance of the largest share class of the ten largest actively managed qualifying mutual funds and ETFs. At this juncture, the track records accumulated for these indices is still limited. The SUSTAIN Large Cap Equity Fund Index, which was initiated as of June 30, 2017 with data back to December 31, 2016, tracks the total return performance of the ten largest actively managed large cap blend domestic equity mutual funds that employ a sustainable investing strategy beyond absolute reliance on exclusionary practices for religious, ethical or social reasons. Using a similar construction approach, the SUSTAIN Bond Fund Index was initiated as of December 31, 2017 while the SUSTAIN index tracking foreign funds has only been calculated since mid-2019 due to the limited availability of like funds prior to that date. As such, this index is excluded from the analysis. For further details regarding construction methodology and current constituents, refer to Sustainable (SUSTAIN) Indices Construction Methodology article.
SUSTAIN Large Cap Equity Fund Index: Beat S&P 500 in 2019 with seven of ten funds outperforming—only 30% underperforming
The SUSTAIN Large Cap Equity Fund Index beat the S&P 500 Index in 2019 by 78 basis points (bps), recording a gain of 32.27% versus an increase of 31.49% produced by the S&P 500. Seven of the ten funds that comprise the SUSTAIN Index generated results that were equal to or greater than the conventional benchmark. These ranged from 31.49% recorded by TIAA-CREF Social Choice Equity Fund Institutional Class to a high of 35.84% achieved by Putnam Sustainable Leaders Fund A. Put another way, only 30% of the funds that comprise the index underperformed the S&P 500 versus 71% on the part of conventional funds, according to SPIVA. Refer to Chart 2.
The average volatility of the ten funds that make up the index, measured as the annualized 3-year standard deviation of returns, is 11.7% versus 12.1% for the S&P 500. Three funds recorded lower than benchmark volatilities and one fund in particular, Pioneer A, posted a 3-year volatility of 7.17% that contributed to the lower average volatility for the 10 fund index.
The results recorded by sustainable funds in 2019 contrast with outcomes registered in both 2017 and 2018 when the SUSTAIN Large Cap Equity Fund Index lagged behind the S&P 500 by 54 bps and 97 bps, respectively. Over the cumulative 3-year period through December 31, 2019, the S&P 500 posted an increase of 53.2% versus an equivalent 49.2% achieved by the SUSTAIN Large Cap Equity Fund Index, or a differential of 3.97%.
SUSTAIN Bond Fund Index: Beat the Bloomberg Barclays US Aggregate Index by 18 bps in 2019 with six of ten funds outperforming-40% underperforming
Like its US equity fund counterpart, the SUSTAIN Bond Fun Index outperformed the Bloomberg Barclays US Aggregate Index by 18 bps, posting an increase of 8.90% versus 8.72%. In this instance, six of the ten funds that comprise the SUSTAIN index generated results that were equal to or greater than the conventional benchmark. These ranged from a low of 8.73% registered by the TIAA-CREF Social Choice Bond Institutional Fund to a high of 10.71% delivered by the Morgan Stanley Institutional Core Plus Fixed Income Institutional Fund. Stated another way, 40% of the funds that comprise the index underperformed the conventional fixed income benchmark. This was actually almost 8% higher when compared to conventional fixed income funds[2]. Refer to Chart 3.
The average volatility of the ten funds that form the index, measured as the annualized 3-year standard deviation of returns, is 2.8% versus 2.9% for the Bloomberg Barclays US Aggregate Index. Nine funds recorded lower or equal to benchmark volatilities, ranging from 2.46% to 2.99%.
The SUSTAIN Fixed Income Fund Index, which was bootstrapped in 2018, lagged that year. Its cumulative 2-year performance, however, puts it ahead of the Bloomberg Barclays US Aggregate Funds Index by 2 bps, having added 11% versus 10.8%.
[1] While the definition of sustainable investing continues to evolve, this refers to a range of overarching investing approaches or strategies that encompass values-based investing, negative screening (exclusions), thematic and impact investing, environmental, social and governance (ESG) integration, company engagement and proxy voting. These are not mutually exclusive.
[2] Bloomberg Barclays US government/Credit Intermediate Index
Premium Articles Access Priority Support 1 Fixed Price
Access to All Data No Credit Card Required Cancel Any Time
Access to Premium Articles Priority Support Save 25%
$99
PER YEAR
Access to exclusive content
Premium Articles
Access 1 Fixed Price
Free Trial
30-Day
Access to exclusive content
Access to All Data No Credit card Required Cancel Any Time
$9.99
MONTHLY
Access to premium content
Access to premium Articles Save 25%
Sustainable Funds Monitor
Funds Glossary
Quarterly On-Line Briefings
Sign up to free newsletters.
By submitting this form, you are consenting to receive marketing emails from: . You can revoke your consent to receive emails at any time by using the SafeUnsubscribe® link, found at the bottom of every email. Emails are serviced by Constant Contact