Summary
- Market returns were mixed in April: The S&P 500 Index eked out a slim gain of 0.38% while investment-grade bonds posted a decline of -0.74%.
- Riskier sustainable model portfolios outperformed more conservative counterparts in April.
- Sustainable funds registered a slight average decline of -0.043% in April, ranging from a low of -4.68% to a high of 6.25%.
- Sustainable funds close April at $280.7 billion in assets, adding $8.7 billion as Morgan Stanley repurposes additional existing funds by adopting ESG integration considerations.
Market Returns were Mixed In April: The S&P 500 Index Eked Out a Slim Gain of 0.38% while Investment-Grade Bonds Posted a Decline of -0.74%.
Overall, market returns were mixed in April. On the one hand, companies posted solid earnings as they benefited from the economy but even more so from the cuts in the U.S. corporate tax rates that bolstered earnings as a result of the Tax Cuts and Jobs Act of 2017 that was passed by Congress and signed by President Trump at the end of last year. At the same time, stocks faced headwinds from higher interest rates, inflation fears, and geopolitical concerns, including uncertainty about a global trade war. Inflation fears picked up some momentum, and while short-term rates remain for now in a range of 1.5% to 1.75% with no expectation for another rate hike in May, the yield on the 10-year Treasury note moved up to 3.03% on April 25th, the highest closing level since December 31, 2013 when the yield hit 3.04%. The 10-year Treasury yield gave up 8 basis points in the last three trading days to end the month at 2.95% on April 30th and a gain of 21 basis points (bps) in April. In contrast, the Sustainable (SUSTAIN) Large Cap Equity Fund Index declined -0.18% in a volatile April, trailing the performance of the S&P 500 by 56 basis points (refer to SUSTAIN Equity Index Declines -0.18% in April and Trails S&P 500 Index by 56 bps). The S&P 500 Index snapped a two-month losing streak and eked out a slim total return gain of 0.38%. This is was not enough, however, to offset the losses sustained during the previous two months. On a year-to-date basis, the index is down -0.38%. Fixed income investors did not do as well. The broad-based Bloomberg Barclays U.S. Aggregate Bond Index gave up -0.74% due to buffeting from rising interest rates, reversing the gain of 0.64% achieved in March. On a year-to-date basis, investment grade bonds are down -2.19%. Crude oil prices, which, in turn, factored into energy stock prices, were up 6.97% while the Energy sector gained 8.51% and led all 11 of the S&P 500 sectors. Utilities and Health Care posted gains of 4.28% and 2.62%, respectively. At the other end of the range were Consumer Staples, Industrials and Information Technology, which gave up -1.92%, -1.77% and -1.70%, respectively. European, Asian and Far East stocks, as measured by the MSCI EAFE Index (net), gained 2.28%. In general, value stocks outperformed growth stocks while small companies finished the month ahead of large-cap stocks.
Share price volatility, which picked up at the end of January, continued into April. U.S. stock markets plummeted on the first trading day of the second quarter primarily due to a combination of uncertainty about a global trade war and major concerns about impending regulation on large-cap technology stocks. The first Monday in April saw a broad-based market selloff that was, according to the Wall Street Journal, the worst start to April since the Great Depression of 1929. The -2.2% decline was followed by a brief and limited recovery as U.S. stocks gained almost 5% to April 18th and thereby managing to erase half of the stock market’s 10.2% decline since starting its descent into correction territory from a peak on January 26th and continuing to February 8th. But the market reversed course again and ended the month of April off -7.8% from its high value in January.
Riskier Sustainable Model Portfolios Outperform More Conservative Counterparts in April
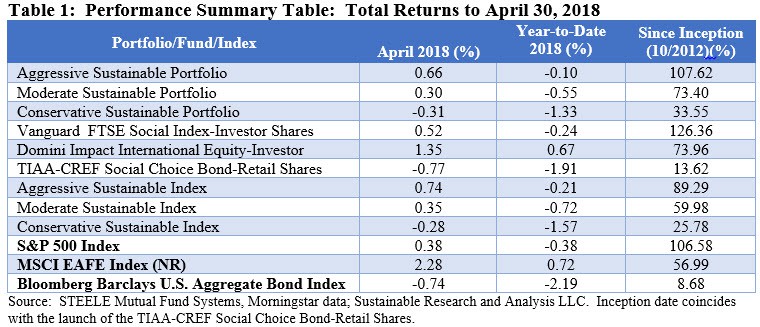
The two sustainable model portfolios with heavier weightings in equities, domestic and international, posted positive total returns in April while the third was pulled down due to its concentration in investment-grade bonds which recorded a decline. The Aggressive Sustainable Portfolio, 95% invested in domestic and international equities, recorded a 0.66% gain while the Moderate Sustainable Portfolio, 60% invested in domestic and international equities, also closed on a positive note with a gain of 0.30%. On the other hand, the Conservative Sustainable Portfolio, which is 80% invested in bonds, reflected the April -0.74% loss posted by the Bloomberg Barclays U.S. Aggregate Bond Index. The Portfolio gave up a more limited -0.31% as it was partly lifted by the Portfolio’s 20% exposure to equities.
The three funds that comprise the model portfolios produced results that directly were in line with their corresponding non-sustainable indexes. Two funds, the Vanguard FTSE Social Index-Investor Shares and TIAA-CREF Social Choice Bond Fund-Retail Shares, produced better than index returns while Domini Impact International Equity-Investor Shares trailed the MSCI EAFE Index (net) by 93 bps.
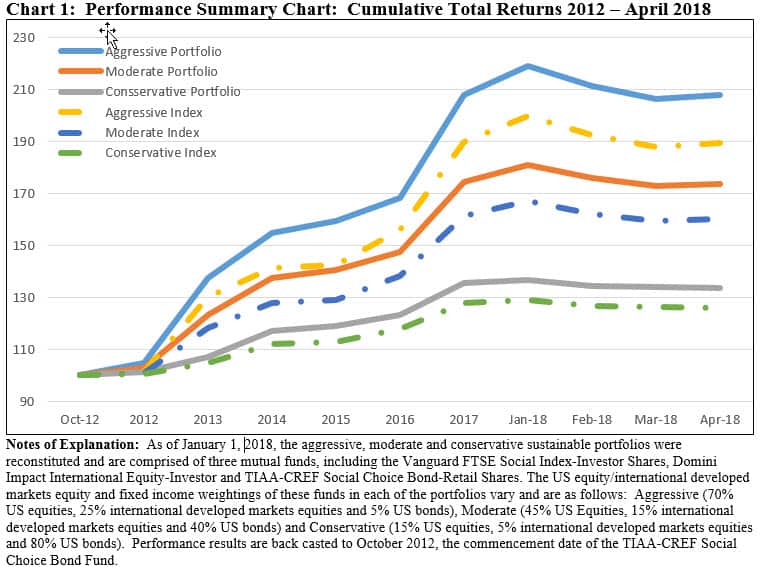
During the month of April, the three sustainable model portfolios trailed each of their corresponding non-sustainable indexes. The reverse is the case when comparing the results on a year-to-date and since inception basis. Since the start of the year, the sustainable portfolios exceed the total return results achieved by their corresponding non-sustainable index by a range from 11 bps to 24 bps. The variations are significantly greater since inception. Refer to Table 1 and Chart 1.
Socially Responsible Mutual Funds Registered Slight Average Decline of -0.043% in April, Ranging from a Low of -4.68% to a High of 6.25%
Within a universe of 952 sustainable funds[1], including mutual funds, exchange-traded funds (ETFs) and exchange-traded notes (ETNs) and their corresponding share classes, returns for the month of March averaged -0.043%. A total of 488 funds, or 51.2%, posted 0.0-to-positive total return results for the month.
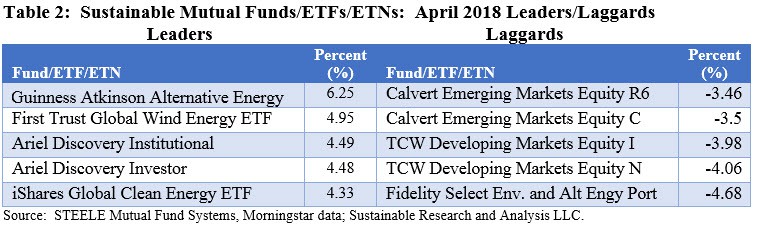
The best performing fund in April was the Guinness Atkinson Alternative Energy Fund, up 6.25%. The fund benefited from its 77.3% non-U.S. stock exposure, including investments in small company stocks, as well as sector and stock selection. The fund maintained a 41.1% exposure to the technology sector and 24.7% to the utility sector. This stood in stark contrast to another but similar thematic fund, the Fidelity Select Environmental and Alternative Energy Portfolio, that trailed all sustainable funds in April with a total return of -4.68%. The fund’s exposure to overseas and small company stocks was more limited at 15.14% and 14.09%, respectively. Further, the fund’s heavy emphasis on the industrial sector coupled with a more concentrated stock positioning detracted from performance in April. For example, 9.42% of the fund’s assets were invested in 3M Company (MMM) which dropped 11.4% in April. Refer to Table 2.
Sustainable Funds Close April at $280.7 Billion, Adding $8.7 Billion as Morgan Stanley Repurposes Additional Existing Funds
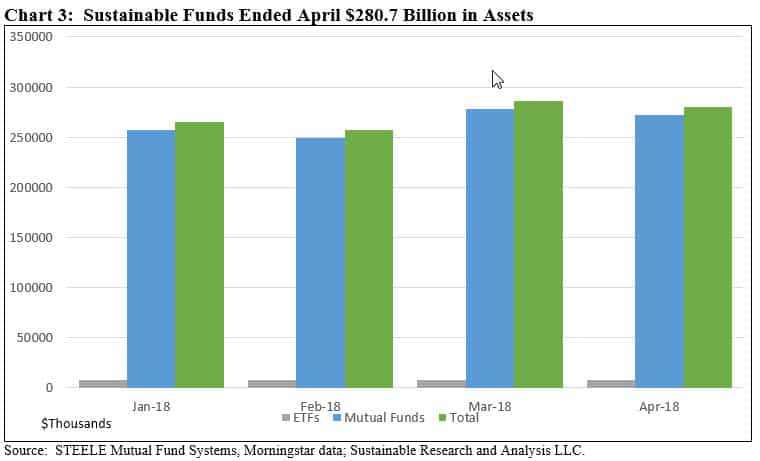
Sustainable funds, a total of 956 funds/share classes, ended the month of April with $280.7 billion in assets under management (AUM). This represents an increase of $8,685 million or 3.2% relative to March 31, 2018 and a gain of $30.3 billion since December 31, 2017. The number of funds ticked up by 47 versus 909 funds last month. The increases in the number of funds and assets is largely attributable to the repurposing of seven Morgan Stanley managed institutional funds (39 share classes) with $8,177.8 billion in assets. Refer to Chart 3.
Mutual funds continue to dominate the sustainable segment, accounting for 885 funds/share classes, with $272.5 billion in net assets or 97.1% of the assets in the sustainable investing segment. ETFs stood at $8.2 billion across 69 funds while an additional product offering in the form of an ETN adds another $19 million in net assets. The sustainable segment is also dominated by equity funds and various other non-fixed income funds that, on a combined basis, represent $260.5 billion in AUM, or 93%, versus fixed income funds that ended April with $20.2 billion.
Retail investors dominate the sustainable funds universe, representing $190.3 billion, or 68% of the segment’s assets versus institutional investors that weigh in with $90.4 billion.
[1] April performance results disclosed for 952 funds/share classes of 956 funds/share classes.
Monthly Sustainable Portfolio Performance Summary: April 2018
Summary Market returns were mixed in April: The S&P 500 Index eked out a slim gain of 0.38% while investment-grade bonds posted a decline of -0.74%. Riskier sustainable model portfolios outperformed more conservative counterparts in April. Sustainable funds registered a slight average decline of -0.043% in April, ranging from a low of -4.68% to a…
Share This Article:
Summary
Market Returns were Mixed In April: The S&P 500 Index Eked Out a Slim Gain of 0.38% while Investment-Grade Bonds Posted a Decline of -0.74%.
Overall, market returns were mixed in April. On the one hand, companies posted solid earnings as they benefited from the economy but even more so from the cuts in the U.S. corporate tax rates that bolstered earnings as a result of the Tax Cuts and Jobs Act of 2017 that was passed by Congress and signed by President Trump at the end of last year. At the same time, stocks faced headwinds from higher interest rates, inflation fears, and geopolitical concerns, including uncertainty about a global trade war. Inflation fears picked up some momentum, and while short-term rates remain for now in a range of 1.5% to 1.75% with no expectation for another rate hike in May, the yield on the 10-year Treasury note moved up to 3.03% on April 25th, the highest closing level since December 31, 2013 when the yield hit 3.04%. The 10-year Treasury yield gave up 8 basis points in the last three trading days to end the month at 2.95% on April 30th and a gain of 21 basis points (bps) in April. In contrast, the Sustainable (SUSTAIN) Large Cap Equity Fund Index declined -0.18% in a volatile April, trailing the performance of the S&P 500 by 56 basis points (refer to SUSTAIN Equity Index Declines -0.18% in April and Trails S&P 500 Index by 56 bps). The S&P 500 Index snapped a two-month losing streak and eked out a slim total return gain of 0.38%. This is was not enough, however, to offset the losses sustained during the previous two months. On a year-to-date basis, the index is down -0.38%. Fixed income investors did not do as well. The broad-based Bloomberg Barclays U.S. Aggregate Bond Index gave up -0.74% due to buffeting from rising interest rates, reversing the gain of 0.64% achieved in March. On a year-to-date basis, investment grade bonds are down -2.19%. Crude oil prices, which, in turn, factored into energy stock prices, were up 6.97% while the Energy sector gained 8.51% and led all 11 of the S&P 500 sectors. Utilities and Health Care posted gains of 4.28% and 2.62%, respectively. At the other end of the range were Consumer Staples, Industrials and Information Technology, which gave up -1.92%, -1.77% and -1.70%, respectively. European, Asian and Far East stocks, as measured by the MSCI EAFE Index (net), gained 2.28%. In general, value stocks outperformed growth stocks while small companies finished the month ahead of large-cap stocks.
Share price volatility, which picked up at the end of January, continued into April. U.S. stock markets plummeted on the first trading day of the second quarter primarily due to a combination of uncertainty about a global trade war and major concerns about impending regulation on large-cap technology stocks. The first Monday in April saw a broad-based market selloff that was, according to the Wall Street Journal, the worst start to April since the Great Depression of 1929. The -2.2% decline was followed by a brief and limited recovery as U.S. stocks gained almost 5% to April 18th and thereby managing to erase half of the stock market’s 10.2% decline since starting its descent into correction territory from a peak on January 26th and continuing to February 8th. But the market reversed course again and ended the month of April off -7.8% from its high value in January.
Riskier Sustainable Model Portfolios Outperform More Conservative Counterparts in April
The two sustainable model portfolios with heavier weightings in equities, domestic and international, posted positive total returns in April while the third was pulled down due to its concentration in investment-grade bonds which recorded a decline. The Aggressive Sustainable Portfolio, 95% invested in domestic and international equities, recorded a 0.66% gain while the Moderate Sustainable Portfolio, 60% invested in domestic and international equities, also closed on a positive note with a gain of 0.30%. On the other hand, the Conservative Sustainable Portfolio, which is 80% invested in bonds, reflected the April -0.74% loss posted by the Bloomberg Barclays U.S. Aggregate Bond Index. The Portfolio gave up a more limited -0.31% as it was partly lifted by the Portfolio’s 20% exposure to equities.
The three funds that comprise the model portfolios produced results that directly were in line with their corresponding non-sustainable indexes. Two funds, the Vanguard FTSE Social Index-Investor Shares and TIAA-CREF Social Choice Bond Fund-Retail Shares, produced better than index returns while Domini Impact International Equity-Investor Shares trailed the MSCI EAFE Index (net) by 93 bps.
During the month of April, the three sustainable model portfolios trailed each of their corresponding non-sustainable indexes. The reverse is the case when comparing the results on a year-to-date and since inception basis. Since the start of the year, the sustainable portfolios exceed the total return results achieved by their corresponding non-sustainable index by a range from 11 bps to 24 bps. The variations are significantly greater since inception. Refer to Table 1 and Chart 1.
Socially Responsible Mutual Funds Registered Slight Average Decline of -0.043% in April, Ranging from a Low of -4.68% to a High of 6.25%
Within a universe of 952 sustainable funds[1], including mutual funds, exchange-traded funds (ETFs) and exchange-traded notes (ETNs) and their corresponding share classes, returns for the month of March averaged -0.043%. A total of 488 funds, or 51.2%, posted 0.0-to-positive total return results for the month.
The best performing fund in April was the Guinness Atkinson Alternative Energy Fund, up 6.25%. The fund benefited from its 77.3% non-U.S. stock exposure, including investments in small company stocks, as well as sector and stock selection. The fund maintained a 41.1% exposure to the technology sector and 24.7% to the utility sector. This stood in stark contrast to another but similar thematic fund, the Fidelity Select Environmental and Alternative Energy Portfolio, that trailed all sustainable funds in April with a total return of -4.68%. The fund’s exposure to overseas and small company stocks was more limited at 15.14% and 14.09%, respectively. Further, the fund’s heavy emphasis on the industrial sector coupled with a more concentrated stock positioning detracted from performance in April. For example, 9.42% of the fund’s assets were invested in 3M Company (MMM) which dropped 11.4% in April. Refer to Table 2.
Sustainable Funds Close April at $280.7 Billion, Adding $8.7 Billion as Morgan Stanley Repurposes Additional Existing Funds
Sustainable funds, a total of 956 funds/share classes, ended the month of April with $280.7 billion in assets under management (AUM). This represents an increase of $8,685 million or 3.2% relative to March 31, 2018 and a gain of $30.3 billion since December 31, 2017. The number of funds ticked up by 47 versus 909 funds last month. The increases in the number of funds and assets is largely attributable to the repurposing of seven Morgan Stanley managed institutional funds (39 share classes) with $8,177.8 billion in assets. Refer to Chart 3.
Mutual funds continue to dominate the sustainable segment, accounting for 885 funds/share classes, with $272.5 billion in net assets or 97.1% of the assets in the sustainable investing segment. ETFs stood at $8.2 billion across 69 funds while an additional product offering in the form of an ETN adds another $19 million in net assets. The sustainable segment is also dominated by equity funds and various other non-fixed income funds that, on a combined basis, represent $260.5 billion in AUM, or 93%, versus fixed income funds that ended April with $20.2 billion.
Retail investors dominate the sustainable funds universe, representing $190.3 billion, or 68% of the segment’s assets versus institutional investors that weigh in with $90.4 billion.
[1] April performance results disclosed for 952 funds/share classes of 956 funds/share classes.
Premium Articles Access Priority Support 1 Fixed Price
Access to All Data No Credit Card Required Cancel Any Time
Access to Premium Articles Priority Support Save 25%
$99
PER YEAR
Access to exclusive content
Premium Articles
Access 1 Fixed Price
Free Trial
30-Day
Access to exclusive content
Access to All Data No Credit card Required Cancel Any Time
$9.99
MONTHLY
Access to premium content
Access to premium Articles Save 25%
Sustainable Funds Monitor
Funds Glossary
Quarterly On-Line Briefings
Sign up to free newsletters.
By submitting this form, you are consenting to receive marketing emails from: . You can revoke your consent to receive emails at any time by using the SafeUnsubscribe® link, found at the bottom of every email. Emails are serviced by Constant Contact