Summary
- S&P 500 Index recorded best gain since January, up 3.72%, while bonds posted an increase of 0.02%; SUSTAIN Large Cap Equity Fund Index and the SUSTAIN Bond Fund Indicator outperformed, up 3.93% and 0.06%, respectively.
- Strong corporate earnings combined with the anticipation of robust economic growth in the second quarter lifted share prices pushed aside for now domestic political and geopolitical uncertainties, global trade war tensions as well as some potential domestic economic headwinds.
- Model portfolios generated positive results in July, ranging from 1.10% to 3.28%.
- Sustainable funds registered an average gain of 2.14%, ranging from 17.17% to -3.87%.
- Closing July at $303.9 billion, sustainable funds logged an estimated $917 million in net inflows, or 0.32% relative to the previous month.
S&P Records Best Gain Since January, Up 3.72%, on the Back of Strong Corporate Earnings and Robust Economic Growth; Bonds Up 0.02%
While technology stocks were rattled by uneven and disappointing earnings reports, punctuated by Facebook’s (FB) biggest ever one-day 19% drop for a U.S.-listed company after the company reported slower-than-expected revenue growth in the second quarter, the S&P 500 Index recorded its best monthly gain since January, up 3.72%. In the process, the S&P 500 expanded its year-to-date and trailing 12-month gains to 6.47% and 16.24%, respectively. At the same time, intermediate investment-grade bonds, as measured by the Bloomberg Barclays US Aggregate Bond Index, eked out a slight gain of 0.02% even as intermediate and long-term interest rates rose. July’s positive bond results stand in contrast to the year-to-date decline of -1.59% and 12-month return of -0.8%.
Strong corporate earnings combined with the anticipation of robust economic growth in the second quarter lifted share prices. In fact, profits for S&P 500 companies increased by an estimated 23.5% in the second quarter, according to data from Thomson Reuters, more than 2.5 times revenue growth in the same period. On the economic front, the Department of Labor reported at the end of the month that gross domestic product expanded 4.1% in the second quarter. While this was slightly below the 4.2% that economists were expecting, it was the highest rate in nearly four years. For the first quarter, growth was revised upward, to 2.2% from 2%. Consumer spending bounced back from the slowdown at the start of the year, business investment climbed and inflation also eased. At least for now, these positive factors discounted domestic political uncertainties that kicked up this month following President Trump’s NATO summit encounter and controversial meeting with Russian counterpart Vladimir Putin in Helsinki, geopolitical concerns, global trade war tensions as well as some potential domestic economic headwinds such as the potential for rising interest rates.
Across the span of major asset classes, geographies and sectors, returns were bracketed at the high end by Latin American equities that led in July with gains as high as 11.21%, reflecting what may have been an improvement in risk sentiment across emerging markets and Brazil in particular. At the other end of the range, commodities lost ground, with crude oil posting a one-month decline of -7.3% (West Texas Intermediate spot price). Within this range, the US dollar gained 5.5% against the Euro, the MSCI EAFE (NR) Index, representing large and mid-cap companies in developed markets around the world, excluding US and Canada, recorded a gain of 2.46% and partially recovered from the losses sustained over the previous two months. Value stocks outperformed growth stocks while small stocks lost some of their momentum and trailed their larger cap counterparts for the first time since February. Also, sustainable funds performed well as both the SUSTAIN Large Cap Equity Fund Index and the SUSTAIN Bond Fund Indicator, up 3.93% and 0.06%, respectively, outperformed their non-sustainable index counterparts.
Model Portfolios Post Positive Results in July, Ranging from 1.10% to 3.28%
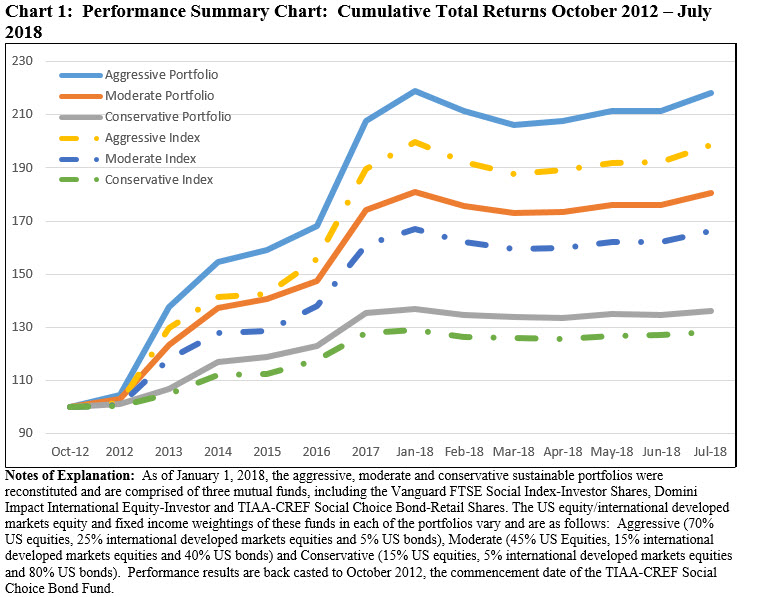
The Aggressive Sustainable Portfolio (95% stocks/5% bonds), Moderate Sustainable Portfolio (60% stocks/40% bonds) and the Conservative Sustainable Portfolio (20%/80%) posted positive results in July, ranging from 1.10% to 3.28%. The portfolios benefited from the total returns achieved by each of the underlying funds, which posted positive outcomes in July even as they slightly lagged their designated index. The Vanguard FTSE Social Index Fund-Investor Shares, for example, was up 3.63% in July, behind the S&P 500 by 9 basis points, but is ahead by almost a half-percentage point relative to the same index on a year-to-date basis. Refer to Table 1.

Except for the Conservative Sustainable Portfolio that matched the 1.10% July return generated by its corresponding non-sustainable index, the Aggressive and Conservative Portfolios lagged marginally behind. This is not the case for performance results since the beginning of the year and since inception as of October 2012. Over the course of the last seven months, the Aggressive, Moderate and Conservative Portfolios were up 4.99%, 3.50% and 0.72%, respectively. Refer to Chart 1.
Sustainable Funds Register Average Gain of 2.14%, Ranging from 17.17% to -3.87%
Within a universe of 1,043 sustainable funds with performance for the full month, including mutual funds, exchange-traded funds (ETFs) and exchange-traded notes (ETNs) and their corresponding share classes, returns for the month of July averaged 2.14%. This was the best average one-month total return performance results turned in by the universe of sustainable funds since January of this year. A total of 970 funds, or 93%, posted 0.00 to positive results for the month.
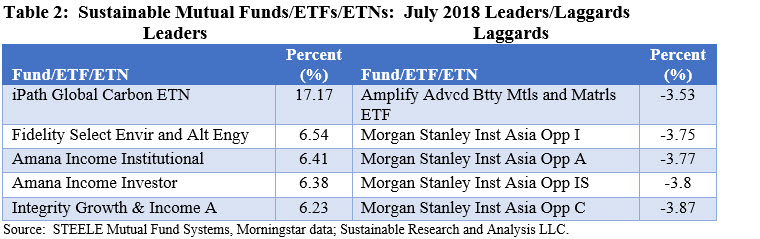
The highest return in July was delivered by the iPath Global Carbon ETN, an $8.8 million exchange-traded note that provides exposure to the global price of carbon by referencing the price of carbon emissions credits from the world’s major emissions related mechanisms. This highly volatile ETN was up 17.17% in July and an eye-popping 127.08% since the start of the year. At the other end of the range stood the Morgan Stanley Institutional Asia Opportunities Fund C Shares, down -3.87% in July. Refer to Table 2. The fund invests primarily in equity securities of issuers located in Asia (excluding Japan), with capitalizations within the range of companies included in the MSCI All Country Asia ex Japan Index. Along with emphasizing a bottom-up stock selection process and seeking high-quality established and emerging companies that are undervalued, Morgan Stanley favors companies it believes have sustainable competitive advantages that can be monetized through growth and the investment process integrates analysis of sustainability with respect to disruptive change, financial strength, environmental and social externalities and governance (referred to as ESG).
Sustainable Funds Close July at $303.9 Billion, with Net Inflows Adding an Estimated $917 million, or 0.32%
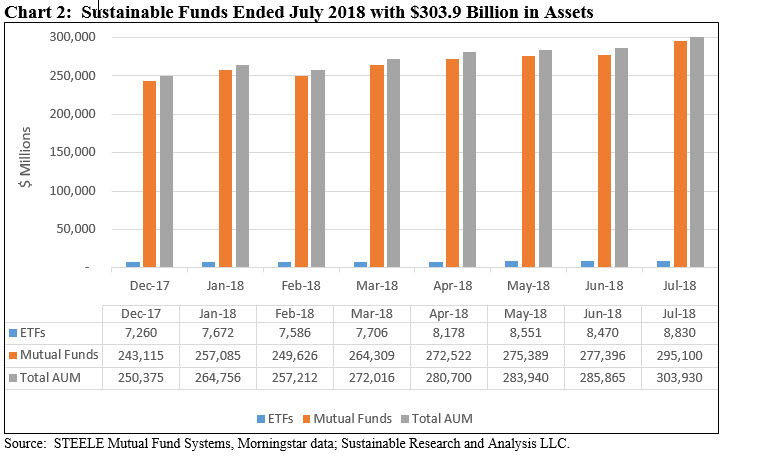
The net assets of 1,046 sustainable funds, including mutual funds, ETFs and ETNs, ended the month of July at $303.9 billion versus $285.9 billion at the end of June. Of the $18 billion increase, an estimated $8.1 billion is attributable to market movement driven by strong economic factors and corporate earnings. Refer to Chart 2.
Two fund firms, Pioneer and American Century repurposed 4 funds, for a total of 12 share classes, the first by formally integrating ESG factors into their funds’ investment strategies and the second by adding a restriction on investment in tobacco stocks. These two fund groups came in with about $9.1 billion recorded in July. At the same time, the universe of sustainable funds experienced approximately $917 million in net inflows, or 0.32%–a level estimated to be roughly in line with the mutual funds and ETF industry combined.
In the process, Pioneer became the 12th largest sustainable fund company within a universe of 116 funds group with explicit sustainable product offerings, and in so doing displaced Eventide Funds from its ranking in the top 20 fund groups by pushing it into 21st place.
Mutual funds ended the month at $295.1 billion, comprised of 970 funds and share classes, accounting for about 97% of sustainable fund assets and unchanged from the previous month. ETFs and ETNs closed the month with $8.8 billion in assets across 76 ETFs.
Monthly Sustainable Portfolios Performance Summary: July 2018
Summary S&P 500 Index recorded best gain since January, up 3.72%, while bonds posted an increase of 0.02%; SUSTAIN Large Cap Equity Fund Index and the SUSTAIN Bond Fund Indicator outperformed, up 3.93% and 0.06%, respectively. Strong corporate earnings combined with the anticipation of robust economic growth in the second quarter lifted share prices pushed…
Share This Article:
Summary
S&P Records Best Gain Since January, Up 3.72%, on the Back of Strong Corporate Earnings and Robust Economic Growth; Bonds Up 0.02%
While technology stocks were rattled by uneven and disappointing earnings reports, punctuated by Facebook’s (FB) biggest ever one-day 19% drop for a U.S.-listed company after the company reported slower-than-expected revenue growth in the second quarter, the S&P 500 Index recorded its best monthly gain since January, up 3.72%. In the process, the S&P 500 expanded its year-to-date and trailing 12-month gains to 6.47% and 16.24%, respectively. At the same time, intermediate investment-grade bonds, as measured by the Bloomberg Barclays US Aggregate Bond Index, eked out a slight gain of 0.02% even as intermediate and long-term interest rates rose. July’s positive bond results stand in contrast to the year-to-date decline of -1.59% and 12-month return of -0.8%.
Strong corporate earnings combined with the anticipation of robust economic growth in the second quarter lifted share prices. In fact, profits for S&P 500 companies increased by an estimated 23.5% in the second quarter, according to data from Thomson Reuters, more than 2.5 times revenue growth in the same period. On the economic front, the Department of Labor reported at the end of the month that gross domestic product expanded 4.1% in the second quarter. While this was slightly below the 4.2% that economists were expecting, it was the highest rate in nearly four years. For the first quarter, growth was revised upward, to 2.2% from 2%. Consumer spending bounced back from the slowdown at the start of the year, business investment climbed and inflation also eased. At least for now, these positive factors discounted domestic political uncertainties that kicked up this month following President Trump’s NATO summit encounter and controversial meeting with Russian counterpart Vladimir Putin in Helsinki, geopolitical concerns, global trade war tensions as well as some potential domestic economic headwinds such as the potential for rising interest rates.
Across the span of major asset classes, geographies and sectors, returns were bracketed at the high end by Latin American equities that led in July with gains as high as 11.21%, reflecting what may have been an improvement in risk sentiment across emerging markets and Brazil in particular. At the other end of the range, commodities lost ground, with crude oil posting a one-month decline of -7.3% (West Texas Intermediate spot price). Within this range, the US dollar gained 5.5% against the Euro, the MSCI EAFE (NR) Index, representing large and mid-cap companies in developed markets around the world, excluding US and Canada, recorded a gain of 2.46% and partially recovered from the losses sustained over the previous two months. Value stocks outperformed growth stocks while small stocks lost some of their momentum and trailed their larger cap counterparts for the first time since February. Also, sustainable funds performed well as both the SUSTAIN Large Cap Equity Fund Index and the SUSTAIN Bond Fund Indicator, up 3.93% and 0.06%, respectively, outperformed their non-sustainable index counterparts.
Model Portfolios Post Positive Results in July, Ranging from 1.10% to 3.28%
The Aggressive Sustainable Portfolio (95% stocks/5% bonds), Moderate Sustainable Portfolio (60% stocks/40% bonds) and the Conservative Sustainable Portfolio (20%/80%) posted positive results in July, ranging from 1.10% to 3.28%. The portfolios benefited from the total returns achieved by each of the underlying funds, which posted positive outcomes in July even as they slightly lagged their designated index. The Vanguard FTSE Social Index Fund-Investor Shares, for example, was up 3.63% in July, behind the S&P 500 by 9 basis points, but is ahead by almost a half-percentage point relative to the same index on a year-to-date basis. Refer to Table 1.
Except for the Conservative Sustainable Portfolio that matched the 1.10% July return generated by its corresponding non-sustainable index, the Aggressive and Conservative Portfolios lagged marginally behind. This is not the case for performance results since the beginning of the year and since inception as of October 2012. Over the course of the last seven months, the Aggressive, Moderate and Conservative Portfolios were up 4.99%, 3.50% and 0.72%, respectively. Refer to Chart 1.
Sustainable Funds Register Average Gain of 2.14%, Ranging from 17.17% to -3.87%
Within a universe of 1,043 sustainable funds with performance for the full month, including mutual funds, exchange-traded funds (ETFs) and exchange-traded notes (ETNs) and their corresponding share classes, returns for the month of July averaged 2.14%. This was the best average one-month total return performance results turned in by the universe of sustainable funds since January of this year. A total of 970 funds, or 93%, posted 0.00 to positive results for the month.
The highest return in July was delivered by the iPath Global Carbon ETN, an $8.8 million exchange-traded note that provides exposure to the global price of carbon by referencing the price of carbon emissions credits from the world’s major emissions related mechanisms. This highly volatile ETN was up 17.17% in July and an eye-popping 127.08% since the start of the year. At the other end of the range stood the Morgan Stanley Institutional Asia Opportunities Fund C Shares, down -3.87% in July. Refer to Table 2. The fund invests primarily in equity securities of issuers located in Asia (excluding Japan), with capitalizations within the range of companies included in the MSCI All Country Asia ex Japan Index. Along with emphasizing a bottom-up stock selection process and seeking high-quality established and emerging companies that are undervalued, Morgan Stanley favors companies it believes have sustainable competitive advantages that can be monetized through growth and the investment process integrates analysis of sustainability with respect to disruptive change, financial strength, environmental and social externalities and governance (referred to as ESG).
Sustainable Funds Close July at $303.9 Billion, with Net Inflows Adding an Estimated $917 million, or 0.32%
The net assets of 1,046 sustainable funds, including mutual funds, ETFs and ETNs, ended the month of July at $303.9 billion versus $285.9 billion at the end of June. Of the $18 billion increase, an estimated $8.1 billion is attributable to market movement driven by strong economic factors and corporate earnings. Refer to Chart 2.
Two fund firms, Pioneer and American Century repurposed 4 funds, for a total of 12 share classes, the first by formally integrating ESG factors into their funds’ investment strategies and the second by adding a restriction on investment in tobacco stocks. These two fund groups came in with about $9.1 billion recorded in July. At the same time, the universe of sustainable funds experienced approximately $917 million in net inflows, or 0.32%–a level estimated to be roughly in line with the mutual funds and ETF industry combined.
In the process, Pioneer became the 12th largest sustainable fund company within a universe of 116 funds group with explicit sustainable product offerings, and in so doing displaced Eventide Funds from its ranking in the top 20 fund groups by pushing it into 21st place.
Mutual funds ended the month at $295.1 billion, comprised of 970 funds and share classes, accounting for about 97% of sustainable fund assets and unchanged from the previous month. ETFs and ETNs closed the month with $8.8 billion in assets across 76 ETFs.
Premium Articles Access Priority Support 1 Fixed Price
Access to All Data No Credit Card Required Cancel Any Time
Access to Premium Articles Priority Support Save 25%
$99
PER YEAR
Access to exclusive content
Premium Articles
Access 1 Fixed Price
Free Trial
30-Day
Access to exclusive content
Access to All Data No Credit card Required Cancel Any Time
$9.99
MONTHLY
Access to premium content
Access to premium Articles Save 25%
Sustainable Funds Monitor
Funds Glossary
Quarterly On-Line Briefings
Sign up to free newsletters.
By submitting this form, you are consenting to receive marketing emails from: . You can revoke your consent to receive emails at any time by using the SafeUnsubscribe® link, found at the bottom of every email. Emails are serviced by Constant Contact