The Bottom Line: Sustainable mutual funds and ETFs reached $2.9 trillion in August and are on a trajectory to exceed $3 trillion within several months.
Sustainable mutual funds and ETFs[1] reached almost $2.9 trillion and are on a trajectory to exceed $3 trillion within several months.
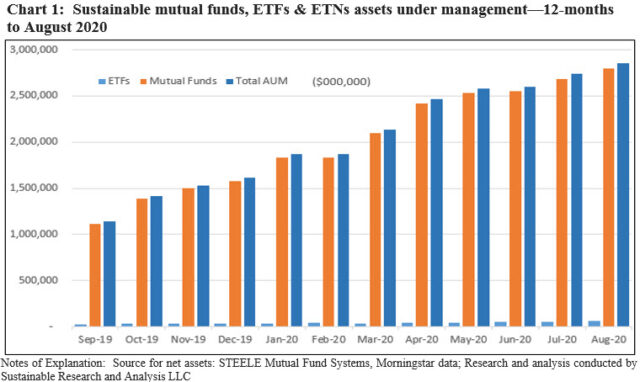
Sustainable mutual funds and ETFs recorded their 12th consecutive monthly rise in assets under management, adding $117.3 billion in August to end the month at $2,856.9 billion. The 4.3% month-over month increase, in the light of an average 3.2% total return gain registered by sustainable funds, was slightly behind July’s 5.15% growth. Barring a market correction, sustainable funds are on a trajectory to exceed $3 trillion within several months.
Sustainable mutual funds closed the month at $2,794.2 billion, posting an increase of 4.2%. ETFs, which gained $5.8 billion, recorded a strong increase again, ticking up 10.2% to end the month at $62.7 billion across 133 funds. Refer to Chart 1.
Positive market movement added an estimated $73.3 billion in the aggregate while net cash inflows added an estimated $37.5 billion
Contributing meaningfully to August’s net assets gain of $117.3 billion was positive market movement that added an estimated $73.3 billion in the aggregate. Net cash inflows, including money market funds, elevated gains for the month by an estimated $37.5 billion. This not only represents a reversal from estimated outflows in June and July but August’s net inflow weighed in at the highest level since March. Re-brandings only added 5.6% of the month’s sustainable fund gains. Excluding money market funds, net cash inflows were slightly higher at an estimated $38.4 billion due to cash outflows from money funds.
ETFs added $3.2 billion in estimated net cash inflows, exceeding last month’s by $244.7 million.
Five firms re-branded six funds and added $6.6 billion in assets
Fund re-brandings have tapered off since reaching a Y-T-D peak in March when $352.8 billion in fund re-brandings was recorded.
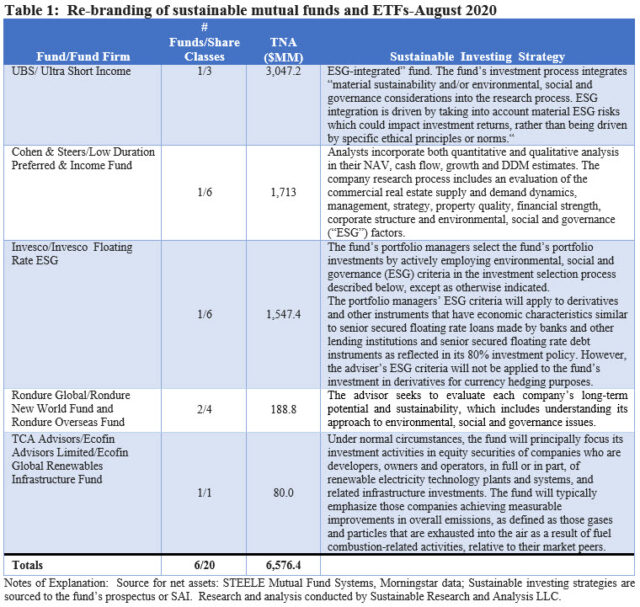
This month, five firms re-branded existing mutual funds, ranging in size from $80 million to about $3.0 billion. Four of the firms integrate ESG factors into investment decisions, including the Invesco Floating Rate ESG fund that explicitly notes that ESG criteria will not be applied to derivative instruments used for currency hedging purposes. Most funds that integrate ESG, excepting some bond funds, typically do not identify security transaction types that may be excluded from ESG consideration. The fifth re-branded fund, Ecofin Global Renewables Infrastructure Fund, is a thematic fund investing in renewable electricity with an emphasis on firms achievable in measurable improvements in overall emissions.
The largest fund was repurposed by UBS AM which reclassified its UBS Ultra Short Income Fund as an “ESG-integrated” fund. The fund’s investment process integrates “material sustainability and/or environmental, social and governance considerations into the research process. ESG integration is driven by taking into account material ESG risks which could impact investment returns, rather than being driven by specific ethical principles or norms.“ Refer to Table 1.
The second largest number of new mutual funds so far this year were added in August
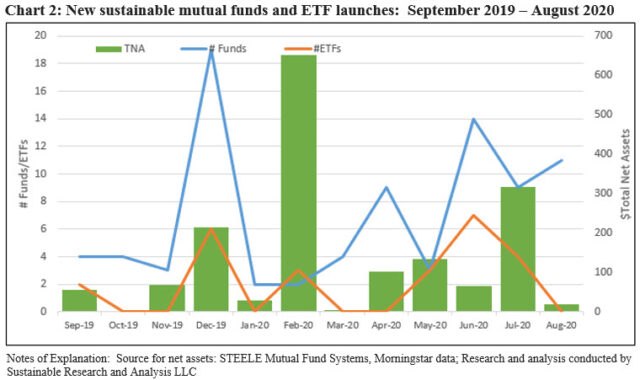
The second largest number of new mutual funds so far this year were added in August, with the launch by BlackRock of 10 target date sustainable funds, each consisting of three share classes and a total of $20 million in assets. The funds, with target dates ranging from 2025 to 2065, intend to invest primarily in affiliated open-end index funds and affiliated exchange-traded funds (ETFs) that are composed of companies that have positive ESG characteristics. Refer to Chart 2.
BlackRock joins two other firms that offer target date sustainable funds, including GuideStone Funds with $4.2 billion in target date assets and Natixis with $61.7 million.
Index funds end August at $65.7 billion while institutional only funds increased slightly to $1.7 trillion
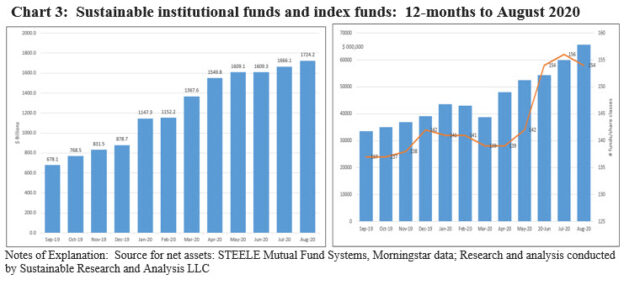
Index funds added $5.8 billion, an uptick relative to last month’s increase of $5.5 billion, to end August at $65.7 billion. This represents a gain of 9.7% versus last month’s $59.9 billion in assets. The top five index fund firms include BlackRock’s iShares, Vanguard, Calvert, Invesco and GuideStone. Together, these firms account for 78% of index mutual fund and ETF assets. The same firms garnered the lion’s share of the month’s flows, sourcing $5,064.1 billion in net assets and accounting for 87% of the increase in August. Invesco in particular, with its line-up of alternative energy funds that performed very well in August, added $757.7 million in net assets for a month-over-month gain of 20%.
Institutional only fund assets, including money market funds, increased slightly to $1.72 trillion at the end of August relative to almost $1.7 trillion at the end of July, and edging up slightly to 61.7% of sustainable fund assets from 62.1% in July. Excluding money market funds, institutional only funds came in at $1.07 trillion and 51% of sustainable fund assets. These numbers likely understate the level of institutional investments in mutual funds as other than institutional only funds/share classes can serve as entry points for investments in funds by institutional investors. Refer to Chart 3.
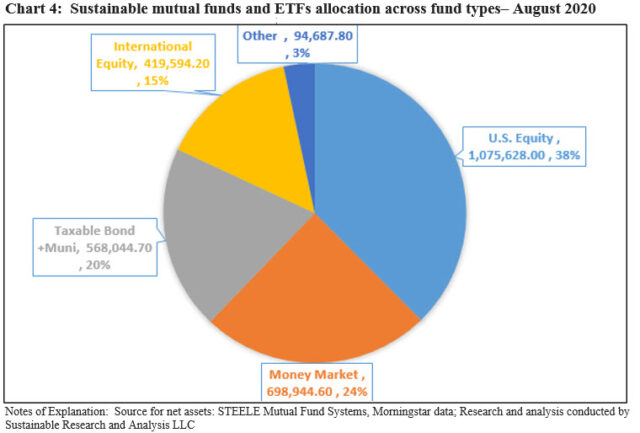
Allocation of fund assets: US Equity funds dominate, followed by money market funds
There were no material month-over-month shifts in the allocation of assets across fund categories during the month of August. US equity funds, including sector equity funds, gained $63.5 billion in net assets, elevating the share of this segment by 71 bps to 37.7% of sustainable fund industry assets under management. Money market funds gave up a 1% share due to fund outflows while the Allocation category of funds, which makes up the largest share of the Other category, gained some $14.9 billion and added 44 bps to its share of the segment’s assets. Refer to Chart 4.
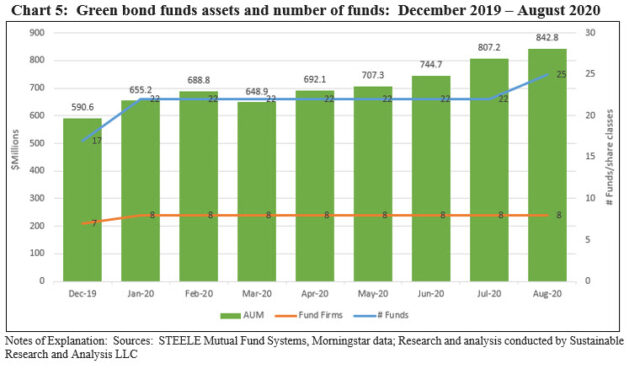
Corporate and municipal green bond funds ended August at $842.8 million and are on track to equal or exceed $1 billion on or prior to year-end
Against a backdrop of rising long-term Treasury yields throughout August, green bond funds, including mutual funds and ETFs, posted a negative -0.38% average total rate of return and beat out the -0.81% recorded by the Bloomberg Barclays US Aggregate Bond Index and -0.49% registered by a narrower-based green bond index. At the same time, the eight corporate and municipal green bond funds ended August at $842.8 million, benefiting from positive cash inflows that added $35.6 million in net assets. Up from $807.2 million last month, the funds continue on track to equal or exceed $1 billion on or prior to year-end even in the light of the announced liquidation and dissolution of the $29.9 million Allianz Green Bond Fund. Green bond issuance reached $13.2 billion in August[2], down from $20 billion the prior month. That said, there is a strong pipeline of green bond issuance going into September 2020, including several sovereign issuers. Refer to Chart 5.
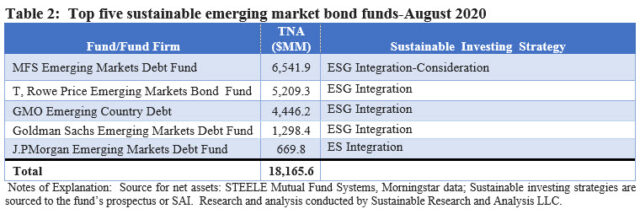
Sector focus: Sustainable emerging market bond funds-21 funds offered by 16 firms managing $20.9 billion in assets
The universe of sustainable emerging market bond funds is small and concentrated. This segment, consisting of funds managed by 16 firms, represents just 4.5% of the $464.9 billion taxable bond funds investment category. The top five funds account for $18.2 billion in assets and represent 86.9% of the emerging bond funds segment. These five funds employ one of two sustainable investing approaches, ESG Integration or ESG Integration-Consideration by which funds may account for ESG factors. Refer to Table 2.
Since the start of the year, sustainable emerging market bond funds have expanded by nine funds from a base line of 12 funds with $13.5 billion in net assets. The expansion is attributable to new firms that entered the sphere by re-branding existing emerging market bond mutual funds and one ETF. Five firms, including DWS, Eaton Vance, Goldman Sachs, Mainstay Candriam (NY Life), and T. Rowe Price rebranded a total of nine funds (56 funds/share classes) with a combined total of $6.9 billion. This was achieved by formally adopting prospectus/SAI amendments to reflect the explicit adoption of a sustainable investing strategy.
Sustainable emerging market funds experienced estimated cash outflows in May and June in the amount of $628.8 million. Cash flows reversed course in July and August when the segment added $465 million or 2.2% of total net assets at the end of August. Performance of the segment has also been a factor. After posting an average -14.80% decline in March and lagging the JPMorgan Emerging Markets Corporate Bond Index by 3.11%, the sustainable emerging markets bond segment recorded five successive months of positive returns. The segment gained a cumulative five month average of 17.4% starting in March and an average monthly gain of 3.3%. Since the start of the year, however, sustainable emerging market bond funds are up a cumulative average of 0.31%.
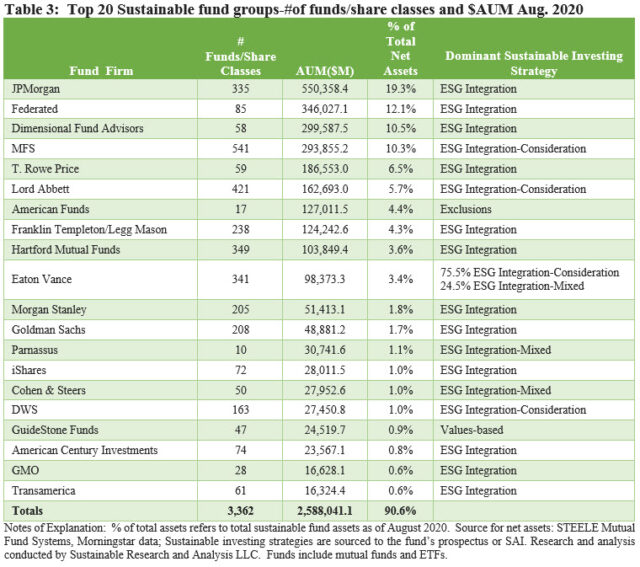
The top 20 firms account for $2,588 billion in net assets, for a market share of 90.6%
Except for a few rank ordering shifts in the segment beyond the top 10 fund firms, the make-up of the top 20 fund management firms, out of 185 firms offering sustainable mutual funds and ETFs, did not change in August. The top 20 firms account for $2,588 billion in net assets, for a market share of 90.6% versus 90.8% at the end of July. Within this segment, the top 10 firms actually dominate as they control 80.2% of the segment’s assets. All but one of these firms manage over $100 billion in sustainable mutual fund and ETF assets.
Also, there were no material changes in the profile of the dominant sustainable investment strategies pursued by the top 20 firms. ESG Integration strategies cover 69% of the assets sourced to the largest firms while ESG Integration-Consideration approaches, wherein ESG factors may be accounted for in making investment decisions, cover almost 22% of the assets. Exclusions apply to 4% while ESG Integration-Mixed, which refers to funds whose core strategy consists of ESG integration, but exclusions, impact or thematic approaches may also be employed, apply to 3.2% of assets. Values-based investing, pursued exclusively by one firm, impacts just 0.9% of assets. Refer to Table 3.
[1] While definitions continue to evolve, sustainable investing refers to a range of five overarching investing approaches or strategies that encompass: values-based investing, negative screening (exclusions), thematic and impact investing and ESG integration. Shareholder/bondholder engagement and proxy voting may also be employed along with one of more of these strategies that are not mutually exclusive.
[2] Source: Climate Bond Initiative (CBI), comprised of CBI aligned green bonds that allocate at least 95% of proceeds to green projects.