Summary
- S&P declined -3.69% in February, partially recovering from a brief 10.2% correction. The SUSTAIN Large Cap Equity Fund Index posted a -3.72% drop, trailing the non-ESG index by just 3 basis points.
- The three sustainable model portfolios also experienced declines, ranging from -4.51% to -0.78%, but in each case exceeded the returns posted by their corresponding non-ESG indexes.
- The net assets of 816 sustainable funds, including mutual funds, ETFs and ETNs, ended the month of February at $257.2 billion versus $264.8 billion at the end of January. An estimated $9.7 billion is attributable to the decline in stock and bond prices during the month of February, bolstered by an estimated $1.8 billion in net new cash, or 0.7%, and $437 million in a new sustainable fund family listing.
S&P Declined -3.69% in February, Recovering Somewhat from a Brief 10.2% Correction
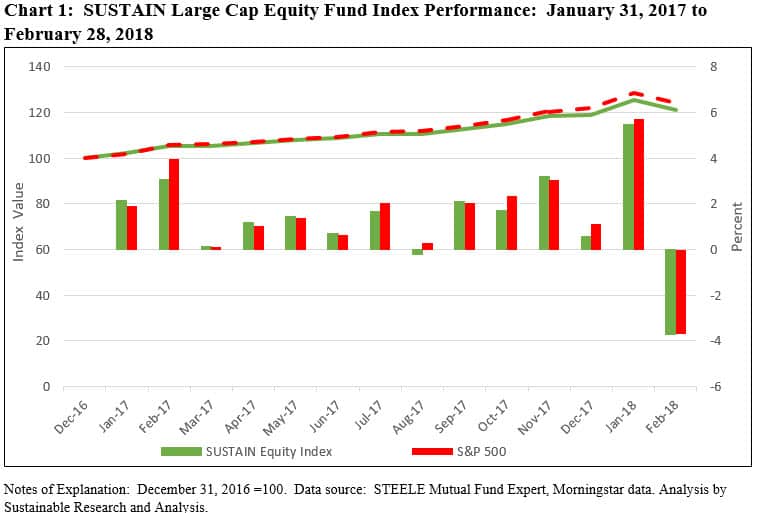
The S&P 500 Index posted a decline of -3.69% for the month, erasing a very strong 5.7% January gain, but reflecting a partial recovery from the short-lived market correction experienced during 9 trading days that commenced on January 27th and ended on February 8th, consistent with the passage and approval in Washington of a short-term spending bill through March 23rd, during which time stocks declined -10.2%. The selloff, which also took the Dow Jones Industrial Average even lower to -4.26%, marked a break with the tranquility that had characterized financial markets for much of the past two years, however, the immediate cause for the abrupt selloff was not abundantly clear, especially given the speedy partial reversal that continued into March. Some analysts speculated that investors got worried following the release of the February 2nd employment and rising average hourly earnings report by the U.S. Bureau of Labor Statistics that showed unexpected wage growth and led to renewed concerns that the Federal Reserve, which expects to raise interest rates three times this year, will raise rates more than expected. Continuing U.S. political turmoil could also have played a role and we are likely to experience more of that in the future. Others tied the decline to technical factors, such as the collapse of volatility tied strategies that came under stress as stock volatility ticked up.
By the end of February, however, sentiment shifted and the S&P 500 was able to notch a 5.1% gain during the remainder of the month and erase some of the earlier losses. More recent Labor Department reports on jobs and inflation were more comforting. At the same time, the GDP growth outlook at about 2.5% (per the Federal Reserve that raised their projection of GDP growth) for the full year remains positive, bolstered by tax cuts in the U.S., the two-year funding deal approved in February that boosts federal spending by almost $300 billion and stronger conditions overseas. These considerations continue to support the growth of corporate earnings and revenues. With nearly all results in for the first quarter, earnings at companies in the S&P 500 were on track to grow by 15% from a year earlier. According to FactSet, this is the fastest pace since the second quarter of 2011.
The February drop, which still left the S&P 500 in positive territory year-to-date with a gain of 1.83%, was the first since October 2016 and only the fourth monthly decline since January 2016. All sectors sustained drops, with the most severe, a -14.4% for the Energy sector, would have been skirted by sustainable funds that either entirely or largely avoid investments in the fossil fuel industry. That said, the SUSTAIN Large Cap Equity Fund Index, which tracks the total return performance of the ten largest actively managed large cap U.S. oriented equity mutual funds that employ a sustainable investment strategy beyond absolute reliance on exclusionary practices, registered a decline of -3.72%, 3 basis points behind the S&P 500 Index. Refer to Chart 1.
Consumer Staples and Healthcare recorded average declines of -9.3% and -8.3%, respectively. At the other end of the range, the Information Technology sector experienced a milder drop of -1.27%. This helped cushion the Nasdaq 100 which posted a decline of -1.22% and exceeded the total return registered by the S&P 500 by 2.47%.
Concerns around interest rates pushed the yield on 10-year Treasury notes to their highest level since January 2014, hitting 2.94% on February 21st but such fears receded and yields trended lower to end February just 15 basis points higher to 2.87% on February 28th. This factor contributed to the -0.95% decline recorded by the BB U.S. Aggregate Bond Index. At the same time, the Sustainable (SUSTAIN) Bond Fund Indicator, a cohort of five sustainable bond funds consisting of similarly managed funds that, like the equity index counterpart, employ sustainable investing strategies beyond absolute reliance on exclusionary practices that track the BB U.S. Aggregate Bond Index, posted a February decline of -0.75%, exceeding the non-ESG benchmark by 20 basis points and an even wider 51 basis points over the previous 12-months.
While still in negative territory for the month, bonds suffered limited losses relative to other major market segments and asset classes, such as small-cap stocks, emerging market equities and U.S. REITs.
Three Sustainable Model Portfolios Post Results in Excess of Corresponding non-ESG Indexes
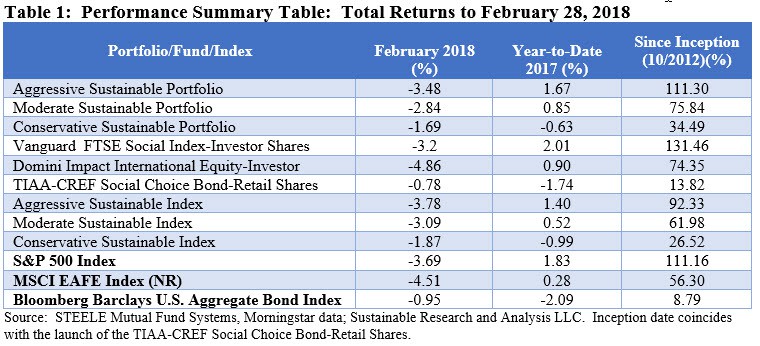
Each of the three underlying sustainable funds that comprise the model portfolios, Aggressive Sustainable Portfolio, Moderate Sustainable Portfolio and Conservative Sustainable Portfolio, posted declines for the month, ranging from -4.51% recorded by the Domini Impact International Equity-Investor to -3.20% attributable to the Vanguard FTSE Social Index-Investor Shares to a -0.78% delivered by TIAA-CREF Social Choice Bond-Retail Shares.
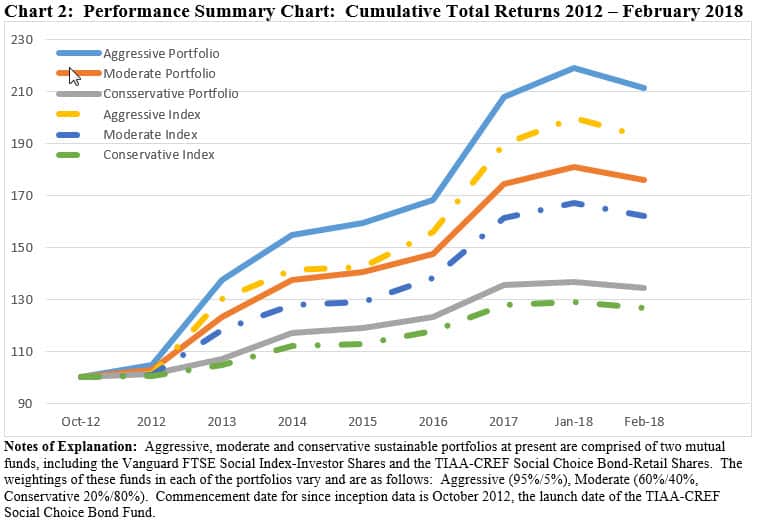
The Vanguard and TIAA-CREF funds both outperformed their corresponding non-ESG indexes. Given their dominant roles in the model portfolios, it’s not surprising that each of the sustainable model portfolios outperformed their corresponding non-ESG indexes. This is also the case on a year-to-date basis as well as since inception in October 2012. Heavily tilted toward fixed income, the Conservative Sustainable Portfolio is the only model portfolio reflecting a year-to-date total return decline of -0.63%. Refer to Table 1 and Chart 2.
Sustainable Funds Register Average Loss of -3.38% in February, Ranging from -8.25 to High of 9.77%
Within a universe of 812[1] sustainable funds, including mutual funds, exchange-traded funds (ETFs) and exchange-traded notes (ETNs) and their corresponding share classes, returns for the month of February averaged -3.38%. Only 17 funds, or 2.1% of sustainable funds, posted 0.00 to positive results for the month.
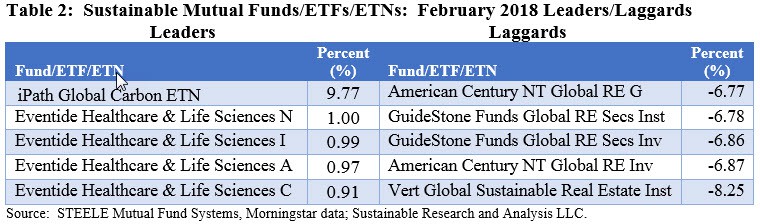
The highest return of 9.77% was delivered by the iPath Global Carbon ETN, an exchange-traded note that provides exposure to the global price of carbon by referencing the price of carbon emissions credits from the world’s major emissions related mechanisms. The highly volatile ETN is up 26.27% on a year-to-date basis and 109.59% for the last twelve months. Average monthly return since its inception in 2008 is 17.5% with a standard deviation of 16.2.
At the other end of the range are five real estate funds, down from -8.25% to -6.77%, in line with the last place performance of the real estate sector. Refer to Table 2.
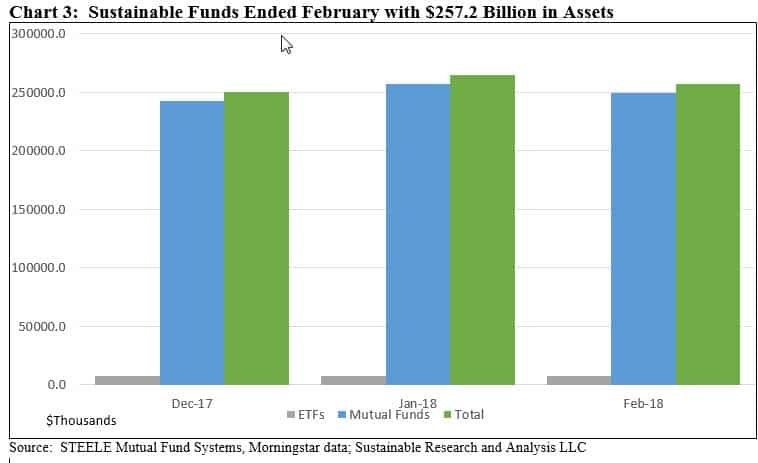
Sustainable Funds’ Total Net Assets Declined to $257.2 Billion due to Market Depreciation but Added an Estimated $1.7 Billion in Net New Cash
The net assets of 816 sustainable funds, including mutual funds, ETFs and ETNs, ended the month of February at $257.2 billion versus $264.8 billion at the end of January. An estimated $9.7 billion is attributable to the decline in stock and bond prices during the month of February, bolstered by an estimated $1.8 billion in net new cash, or an increase of 0.7% and $437 million in a new sustainable fund family listing. Refer to Chart 3.
Mutual funds ended the month at $249.6 billion, comprised of 750 funds and share classes, accounting for 97% of sustainable fund assets. ETFs and ETNs closed the month with $7.6 billion in assets across 66 ETFs.
The largest net asset gainers during the month were: Calvert Investments, $45.4 million, PIMCO, $44.8 million and American Beacon, $37.6 million. Five new funds/share classes were added during the course of the month.
[1] All funds reporting performance results for the full month of February.
Sustainable Portfolios Performance Summary: February 2018
Summary S&P declined -3.69% in February, partially recovering from a brief 10.2% correction. The SUSTAIN Large Cap Equity Fund Index posted a -3.72% drop, trailing the non-ESG index by just 3 basis points. The three sustainable model portfolios also experienced declines, ranging from -4.51% to -0.78%, but in each case exceeded the returns posted by…
Share This Article:
Summary
S&P Declined -3.69% in February, Recovering Somewhat from a Brief 10.2% Correction
The S&P 500 Index posted a decline of -3.69% for the month, erasing a very strong 5.7% January gain, but reflecting a partial recovery from the short-lived market correction experienced during 9 trading days that commenced on January 27th and ended on February 8th, consistent with the passage and approval in Washington of a short-term spending bill through March 23rd, during which time stocks declined -10.2%. The selloff, which also took the Dow Jones Industrial Average even lower to -4.26%, marked a break with the tranquility that had characterized financial markets for much of the past two years, however, the immediate cause for the abrupt selloff was not abundantly clear, especially given the speedy partial reversal that continued into March. Some analysts speculated that investors got worried following the release of the February 2nd employment and rising average hourly earnings report by the U.S. Bureau of Labor Statistics that showed unexpected wage growth and led to renewed concerns that the Federal Reserve, which expects to raise interest rates three times this year, will raise rates more than expected. Continuing U.S. political turmoil could also have played a role and we are likely to experience more of that in the future. Others tied the decline to technical factors, such as the collapse of volatility tied strategies that came under stress as stock volatility ticked up.
By the end of February, however, sentiment shifted and the S&P 500 was able to notch a 5.1% gain during the remainder of the month and erase some of the earlier losses. More recent Labor Department reports on jobs and inflation were more comforting. At the same time, the GDP growth outlook at about 2.5% (per the Federal Reserve that raised their projection of GDP growth) for the full year remains positive, bolstered by tax cuts in the U.S., the two-year funding deal approved in February that boosts federal spending by almost $300 billion and stronger conditions overseas. These considerations continue to support the growth of corporate earnings and revenues. With nearly all results in for the first quarter, earnings at companies in the S&P 500 were on track to grow by 15% from a year earlier. According to FactSet, this is the fastest pace since the second quarter of 2011.
The February drop, which still left the S&P 500 in positive territory year-to-date with a gain of 1.83%, was the first since October 2016 and only the fourth monthly decline since January 2016. All sectors sustained drops, with the most severe, a -14.4% for the Energy sector, would have been skirted by sustainable funds that either entirely or largely avoid investments in the fossil fuel industry. That said, the SUSTAIN Large Cap Equity Fund Index, which tracks the total return performance of the ten largest actively managed large cap U.S. oriented equity mutual funds that employ a sustainable investment strategy beyond absolute reliance on exclusionary practices, registered a decline of -3.72%, 3 basis points behind the S&P 500 Index. Refer to Chart 1.
Consumer Staples and Healthcare recorded average declines of -9.3% and -8.3%, respectively. At the other end of the range, the Information Technology sector experienced a milder drop of -1.27%. This helped cushion the Nasdaq 100 which posted a decline of -1.22% and exceeded the total return registered by the S&P 500 by 2.47%.
Concerns around interest rates pushed the yield on 10-year Treasury notes to their highest level since January 2014, hitting 2.94% on February 21st but such fears receded and yields trended lower to end February just 15 basis points higher to 2.87% on February 28th. This factor contributed to the -0.95% decline recorded by the BB U.S. Aggregate Bond Index. At the same time, the Sustainable (SUSTAIN) Bond Fund Indicator, a cohort of five sustainable bond funds consisting of similarly managed funds that, like the equity index counterpart, employ sustainable investing strategies beyond absolute reliance on exclusionary practices that track the BB U.S. Aggregate Bond Index, posted a February decline of -0.75%, exceeding the non-ESG benchmark by 20 basis points and an even wider 51 basis points over the previous 12-months.
While still in negative territory for the month, bonds suffered limited losses relative to other major market segments and asset classes, such as small-cap stocks, emerging market equities and U.S. REITs.
Three Sustainable Model Portfolios Post Results in Excess of Corresponding non-ESG Indexes
Each of the three underlying sustainable funds that comprise the model portfolios, Aggressive Sustainable Portfolio, Moderate Sustainable Portfolio and Conservative Sustainable Portfolio, posted declines for the month, ranging from -4.51% recorded by the Domini Impact International Equity-Investor to -3.20% attributable to the Vanguard FTSE Social Index-Investor Shares to a -0.78% delivered by TIAA-CREF Social Choice Bond-Retail Shares.
The Vanguard and TIAA-CREF funds both outperformed their corresponding non-ESG indexes. Given their dominant roles in the model portfolios, it’s not surprising that each of the sustainable model portfolios outperformed their corresponding non-ESG indexes. This is also the case on a year-to-date basis as well as since inception in October 2012. Heavily tilted toward fixed income, the Conservative Sustainable Portfolio is the only model portfolio reflecting a year-to-date total return decline of -0.63%. Refer to Table 1 and Chart 2.
Sustainable Funds Register Average Loss of -3.38% in February, Ranging from -8.25 to High of 9.77%
Within a universe of 812[1] sustainable funds, including mutual funds, exchange-traded funds (ETFs) and exchange-traded notes (ETNs) and their corresponding share classes, returns for the month of February averaged -3.38%. Only 17 funds, or 2.1% of sustainable funds, posted 0.00 to positive results for the month.
The highest return of 9.77% was delivered by the iPath Global Carbon ETN, an exchange-traded note that provides exposure to the global price of carbon by referencing the price of carbon emissions credits from the world’s major emissions related mechanisms. The highly volatile ETN is up 26.27% on a year-to-date basis and 109.59% for the last twelve months. Average monthly return since its inception in 2008 is 17.5% with a standard deviation of 16.2.
At the other end of the range are five real estate funds, down from -8.25% to -6.77%, in line with the last place performance of the real estate sector. Refer to Table 2.
Sustainable Funds’ Total Net Assets Declined to $257.2 Billion due to Market Depreciation but Added an Estimated $1.7 Billion in Net New Cash
The net assets of 816 sustainable funds, including mutual funds, ETFs and ETNs, ended the month of February at $257.2 billion versus $264.8 billion at the end of January. An estimated $9.7 billion is attributable to the decline in stock and bond prices during the month of February, bolstered by an estimated $1.8 billion in net new cash, or an increase of 0.7% and $437 million in a new sustainable fund family listing. Refer to Chart 3.
Mutual funds ended the month at $249.6 billion, comprised of 750 funds and share classes, accounting for 97% of sustainable fund assets. ETFs and ETNs closed the month with $7.6 billion in assets across 66 ETFs.
The largest net asset gainers during the month were: Calvert Investments, $45.4 million, PIMCO, $44.8 million and American Beacon, $37.6 million. Five new funds/share classes were added during the course of the month.
[1] All funds reporting performance results for the full month of February.
Premium Articles Access Priority Support 1 Fixed Price
Access to All Data No Credit Card Required Cancel Any Time
Access to Premium Articles Priority Support Save 25%
$99
PER YEAR
Access to exclusive content
Premium Articles
Access 1 Fixed Price
Free Trial
30-Day
Access to exclusive content
Access to All Data No Credit card Required Cancel Any Time
$9.99
MONTHLY
Access to premium content
Access to premium Articles Save 25%
Sustainable Funds Monitor
Funds Glossary
Quarterly On-Line Briefings
Sign up to free newsletters.
By submitting this form, you are consenting to receive marketing emails from: . You can revoke your consent to receive emails at any time by using the SafeUnsubscribe® link, found at the bottom of every email. Emails are serviced by Constant Contact